.jpg&w=3840&q=100)
1. What is the projected Compound Annual Growth Rate (CAGR) of the Reinforcing Phenolic Resins?
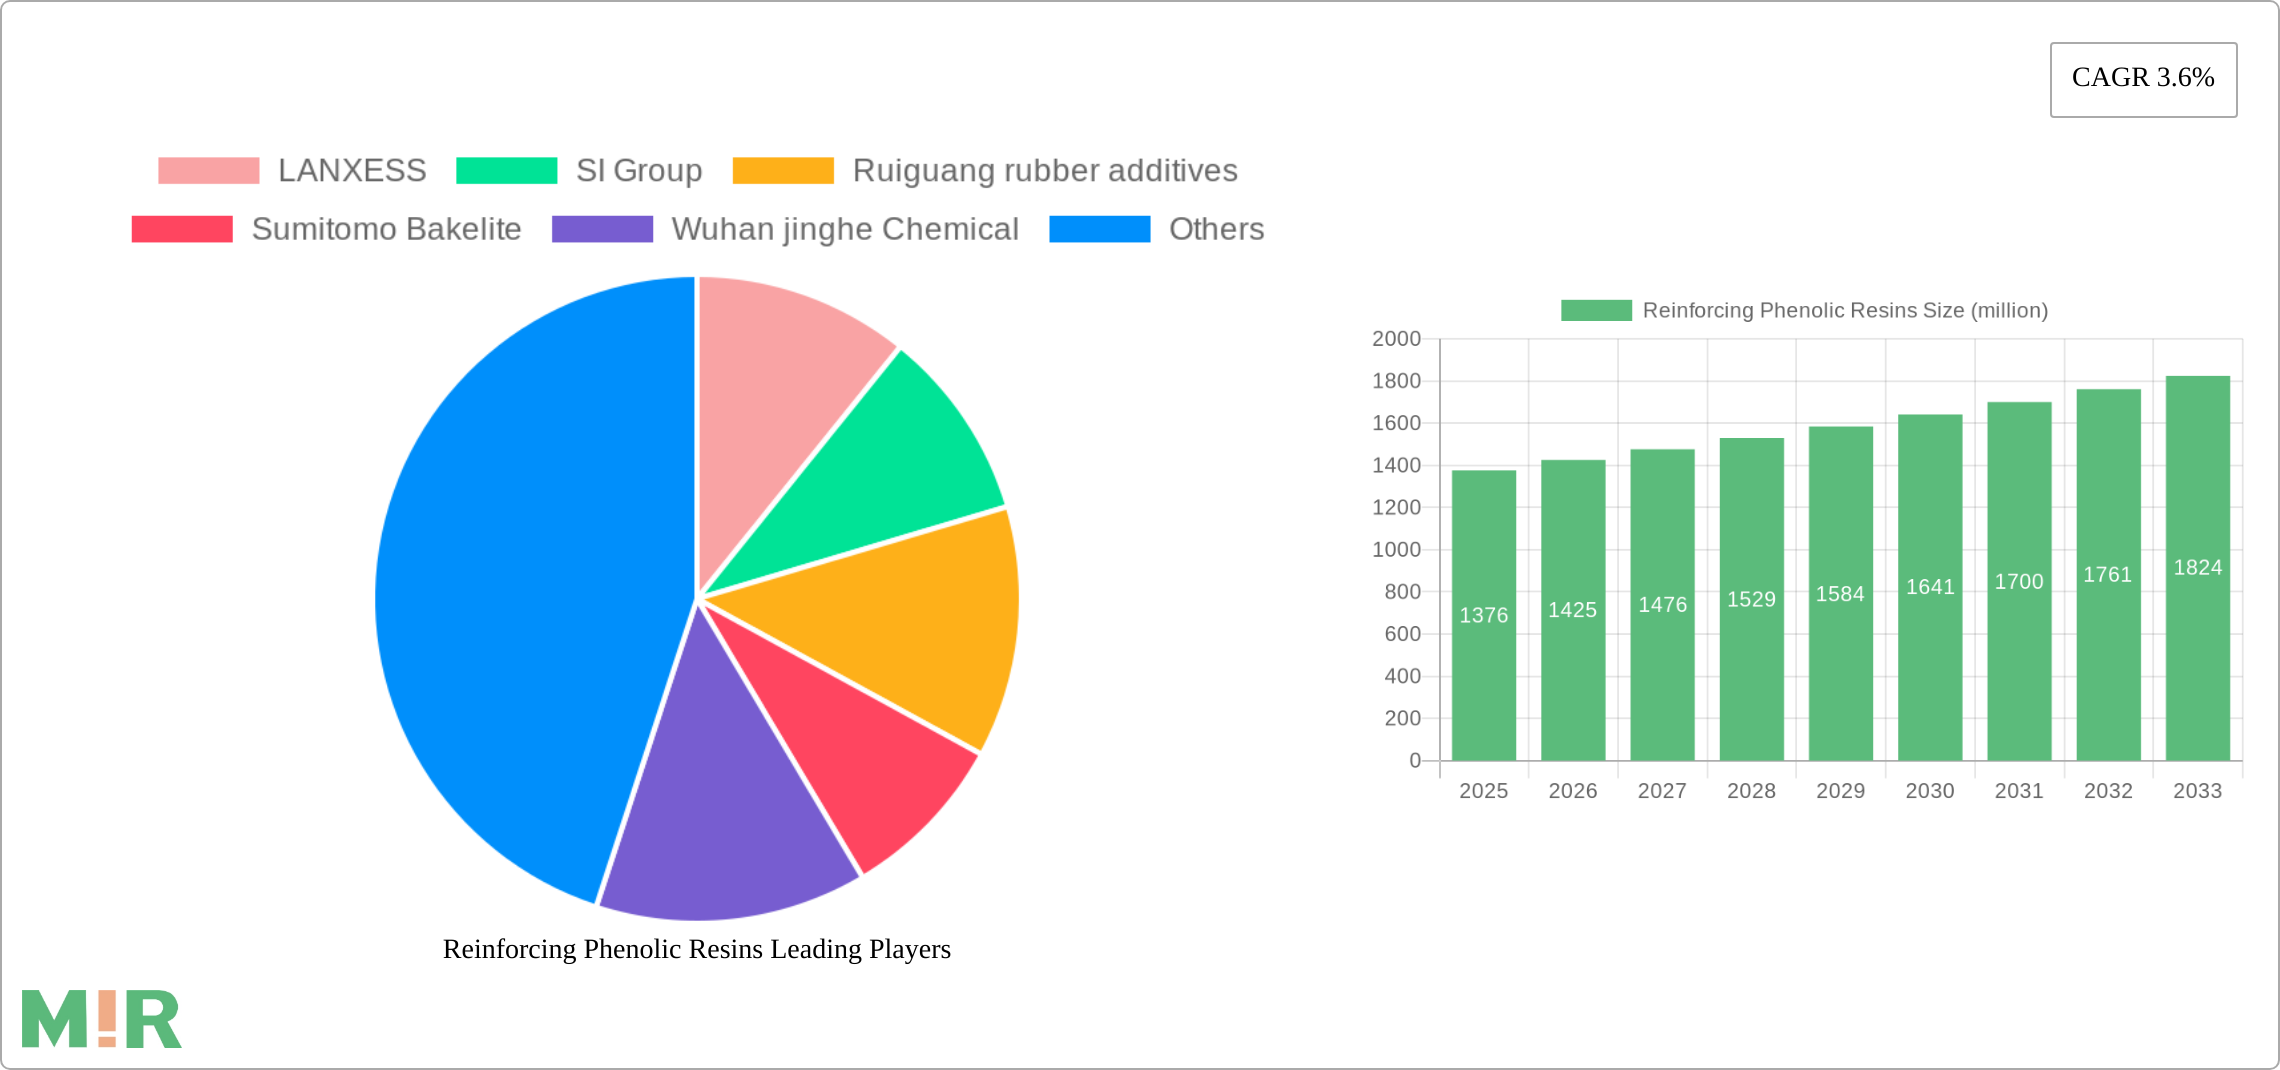
The projected CAGR is approximately 3.6%.

Market
Insights
Reports delivered globally, covering a wide range of industries and sectors.
Clients who trust our expertise and rely on our insights for business decisions.
Managed Reports, ensuring seamless updates and premium service.
Satisfied Customers, committed to delivering exceptional value and quality.
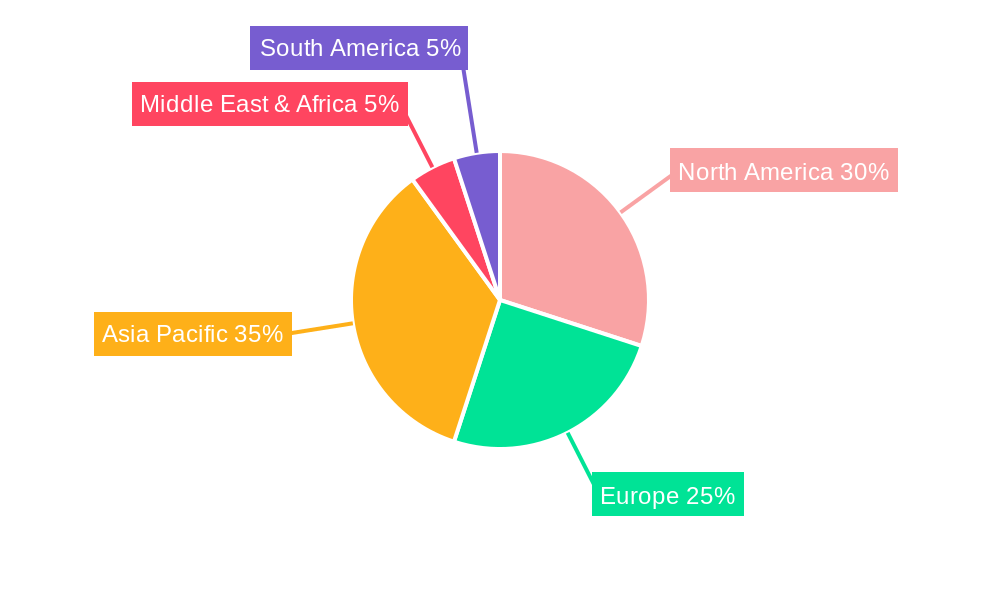
Reinforcing Phenolic Resins by Application (Tire, Sole Glue, Window Seal, Conveyor, Others), by Types (Thermoplastic Type, Thermoset Type), by North America (United States, Canada, Mexico), by South America (Brazil, Argentina, Rest of South America), by Europe (United Kingdom, Germany, France, Italy, Spain, Russia, Benelux, Nordics, Rest of Europe), by Middle East & Africa (Turkey, Israel, GCC, North Africa, South Africa, Rest of Middle East & Africa), by Asia Pacific (China, India, Japan, South Korea, ASEAN, Oceania, Rest of Asia Pacific) Forecast 2025-2033
The Reinforcing Phenolic Resins market, valued at $1376 million in 2025, is projected to experience steady growth, driven by increasing demand across diverse applications. The 3.6% CAGR indicates a consistent expansion throughout the forecast period (2025-2033). Key application segments like tires, adhesives (sole glue, window seal), and conveyor belts are major contributors to market growth, fueled by the need for durable, heat-resistant, and chemically resistant materials in these industries. The thermoplastic type is anticipated to hold a larger market share compared to the thermoset type due to its versatility and processing ease, although both segments will witness growth. Significant regional markets include North America (driven by automotive and construction industries) and Asia-Pacific (led by China and India's expanding manufacturing sectors). However, fluctuating raw material prices and stringent environmental regulations pose potential restraints on market expansion. Competitive landscape analysis reveals a mix of established global players like LANXESS and SI Group and regional manufacturers. The market is expected to benefit from ongoing research and development efforts focused on enhancing the performance and sustainability of reinforcing phenolic resins.
The forecast period will likely see a shift towards sustainable and high-performance variants of reinforcing phenolic resins to meet evolving industry demands. Technological advancements and innovations will play a crucial role in shaping the market trajectory. Companies are focusing on product diversification and strategic partnerships to capitalize on emerging opportunities. Growth in the construction and automotive sectors, especially in developing economies, will create significant demand. While challenges related to raw material costs and environmental concerns remain, the overall market outlook for reinforcing phenolic resins remains positive, indicating significant potential for expansion and innovation in the coming years. The market will likely witness increased consolidation among players as they seek to enhance their market share and global presence.
The global reinforcing phenolic resins market is estimated at $2.5 billion in 2023. Concentration is high, with a few major players controlling a significant market share. LANXESS, SI Group, and Sumitomo Bakelite are among the leading global players, each holding a substantial portion of the market. Regional concentration is evident in Asia-Pacific, particularly China, due to its robust automotive and construction sectors.
Concentration Areas:
Characteristics of Innovation:
Impact of Regulations:
Stringent environmental regulations are driving the development of more sustainable and less polluting reinforcing phenolic resins. This includes stricter emission standards and regulations on the use of hazardous chemicals.
Product Substitutes:
Reinforcing phenolic resins face competition from other thermosetting and thermoplastic polymers, such as epoxy resins, polyurethanes, and engineering plastics. However, their unique combination of properties makes them competitive in many high-performance applications.
End-User Concentration:
The automotive industry is a major end-user, followed by the construction and industrial sectors. The concentration is relatively high within these key sectors.
Level of M&A:
The market has witnessed moderate M&A activity in recent years, driven by the need for companies to expand their product portfolios and geographic reach.
The reinforcing phenolic resins market is witnessing several key trends. The growing automotive industry, particularly the increasing demand for electric vehicles (EVs), is a major driver. EVs require high-performance components capable of withstanding extreme temperatures and vibrations, making reinforcing phenolic resins an ideal choice. The construction industry's expansion, particularly in emerging economies, also fuels demand for durable and cost-effective materials.
Furthermore, the trend toward lightweighting in various industries, including aerospace and automotive, is boosting the demand for resins with high strength-to-weight ratios. This is prompting manufacturers to develop and optimize reinforcing phenolic resins with improved mechanical properties. Sustainability concerns are also shaping the market, with an increasing focus on reducing the environmental footprint of resin production and end-of-life management. This includes exploring bio-based raw materials and developing more recyclable resins.
Technological advancements in resin formulations are leading to enhanced performance characteristics, such as improved heat resistance, chemical resistance, and dimensional stability. These advancements are expanding the applications of reinforcing phenolic resins into new high-growth sectors like renewable energy and electronics. Moreover, the development of specialized grades tailored to specific customer requirements is increasing the market competitiveness and customization opportunities. Finally, strategic collaborations and joint ventures between resin manufacturers and end-users are becoming increasingly common. These partnerships focus on developing customized solutions and improving the supply chain efficiency. The evolving regulatory landscape, with stringent environmental regulations and safety standards, is driving the innovation of eco-friendly and compliant reinforcing phenolic resins. These changes necessitate the development of novel formulations and processes that minimize environmental impact.
The Asia-Pacific region, specifically China, is projected to dominate the reinforcing phenolic resins market, driven by its substantial automotive and construction sectors. The region's rapid industrialization and urbanization are key factors influencing this dominance.
Dominant Segments:
Reasons for Dominance:
This report provides a comprehensive analysis of the reinforcing phenolic resins market, covering market size, growth projections, key players, segment-wise analysis (applications and types), regional market dynamics, and future growth opportunities. It also delves into the competitive landscape, including M&A activities and strategic partnerships. The deliverables include detailed market data, market segmentation analysis, competitive landscape analysis, and future market outlook with growth projections. The report will equip stakeholders with a holistic understanding of the market and facilitate informed decision-making.
The global reinforcing phenolic resins market is experiencing robust growth, driven by increasing demand from various end-use industries, particularly automotive and construction. The market size is estimated to be approximately $2.5 billion in 2023, with an estimated Compound Annual Growth Rate (CAGR) of 5% projected for the next five years, reaching an estimated $3.3 billion by 2028. This growth is fueled by increasing vehicle production, the expansion of construction activities, and advancements in material science leading to enhanced resin performance.
Market share is concentrated among a few major players, with LANXESS, SI Group, and Sumitomo Bakelite holding significant market positions. However, smaller regional players and new entrants are also making inroads, particularly in emerging economies. The market is characterized by a complex interplay of factors impacting growth, including raw material prices, technological advancements, regulatory compliance, and economic conditions. Price fluctuations in raw materials like phenol and formaldehyde can significantly affect the overall market profitability and growth trajectory. The development and adoption of sustainable and environmentally friendly manufacturing processes are essential for long-term market success. The competitive landscape is dynamic, with ongoing efforts to improve product performance, enhance processing technologies, and expand into new markets. The market's future growth depends on several factors, including continuous innovation in resin formulations, effective supply chain management, and adaptation to changing regulatory requirements.
The growth of the reinforcing phenolic resins market is propelled by several key factors: the rising demand from the automotive industry (especially for tires and other components), the expansion of construction and infrastructure development globally, and the increasing need for lightweight yet durable materials across various sectors. Furthermore, technological advancements in resin formulations resulting in superior performance characteristics, coupled with the development of sustainable and environmentally friendly production processes, are significant drivers.
Challenges faced by the reinforcing phenolic resins market include fluctuations in raw material prices, stringent environmental regulations, and competition from alternative materials. The high cost of production, coupled with concerns regarding the environmental impact of some manufacturing processes, pose further challenges. Developing sustainable production methods and mitigating the risks associated with raw material price volatility are critical for overcoming these hurdles.
Emerging trends include the development of bio-based phenolic resins, the use of advanced fillers to enhance material properties, and a focus on improving the recyclability of resins. There is also a growing emphasis on tailor-made resin formulations to meet specific customer needs across diverse sectors, fostering market innovation.
| Aspects | Details |
|---|---|
| Study Period | 2019-2033 |
| Base Year | 2024 |
| Estimated Year | 2025 |
| Forecast Period | 2025-2033 |
| Historical Period | 2019-2024 |
| Growth Rate | CAGR of 3.6% from 2019-2033 |
| Segmentation |
|


Note* : In applicable scenarios
Primary Research
Secondary Research

Involves using different sources of information in order to increase the validity of a study
These sources are likely to be stakeholders in a program - participants, other researchers, program staff, other community members, and so on.
Then we put all data in single framework & apply various statistical tools to find out the dynamic on the market.
During the analysis stage, feedback from the stakeholder groups would be compared to determine areas of agreement as well as areas of divergence
The projected CAGR is approximately 3.6%.
Key companies in the market include LANXESS, SI Group, Ruiguang rubber additives, Sumitomo Bakelite, Wuhan jinghe Chemical, Shanghai Liluo Industrial, Willing New Materials Technology, Taiyuan Keyuanda Fine Chemicals, Shanxi Chemical Research Institute Rubber and Plastic Additives, Sino Legend (China) Chemical.
The market segments include Application, Types.
The market size is estimated to be USD 1376 million as of 2022.
N/A
N/A
N/A
N/A
Pricing options include single-user, multi-user, and enterprise licenses priced at USD 4250.00, USD 6375.00, and USD 8500.00 respectively.
The market size is provided in terms of value, measured in million and volume, measured in K.
Yes, the market keyword associated with the report is "Reinforcing Phenolic Resins," which aids in identifying and referencing the specific market segment covered.
The pricing options vary based on user requirements and access needs. Individual users may opt for single-user licenses, while businesses requiring broader access may choose multi-user or enterprise licenses for cost-effective access to the report.
While the report offers comprehensive insights, it's advisable to review the specific contents or supplementary materials provided to ascertain if additional resources or data are available.
To stay informed about further developments, trends, and reports in the Reinforcing Phenolic Resins, consider subscribing to industry newsletters, following relevant companies and organizations, or regularly checking reputable industry news sources and publications.
See the similar reports
Market Insights Reports offers comprehensive market research reports and analysis, giving businesses important information about their clients, rivals, and sector to help them make well-informed decisions on operations, marketing, and business strategy. We offer a variety of services in addition to market research, data analysis, and strategy planning. In order to find opportunities and learn more about our competitors and the industry at large, we employ competitive analysis. To identify areas for development, we also evaluate our performance against that of our rivals. We can determine the places at which we can offer our clients the most value by performing value chain analysis.
Additionally, clients receive a thorough overview of their industry business environment. We can find trends that help us forecast future possibilities and threats by examining global macroeconomic dynamics and consumer behavior patterns. By analyzing their features and advantages, contrasting them with comparable items on the market, and evaluating both their quantitative and qualitative performance, we comprehensively evaluate our clients' products. This allows us to assist customers in determining how their goods compare to those of their rivals and in creating successful marketing plans. Our group has been successful in gaining a thorough grasp of our clients' requirements and offering them creative solutions. We currently provide services to more than 50 nations in Europe, the Middle East, Africa, Latin America, Asia Pacific, and North America. Because of our global reach, we have been able to establish trusting bonds with our partners and clients in various nations, improving customer service and forging a more cohesive worldwide presence.

