.jpg&w=3840&q=100)
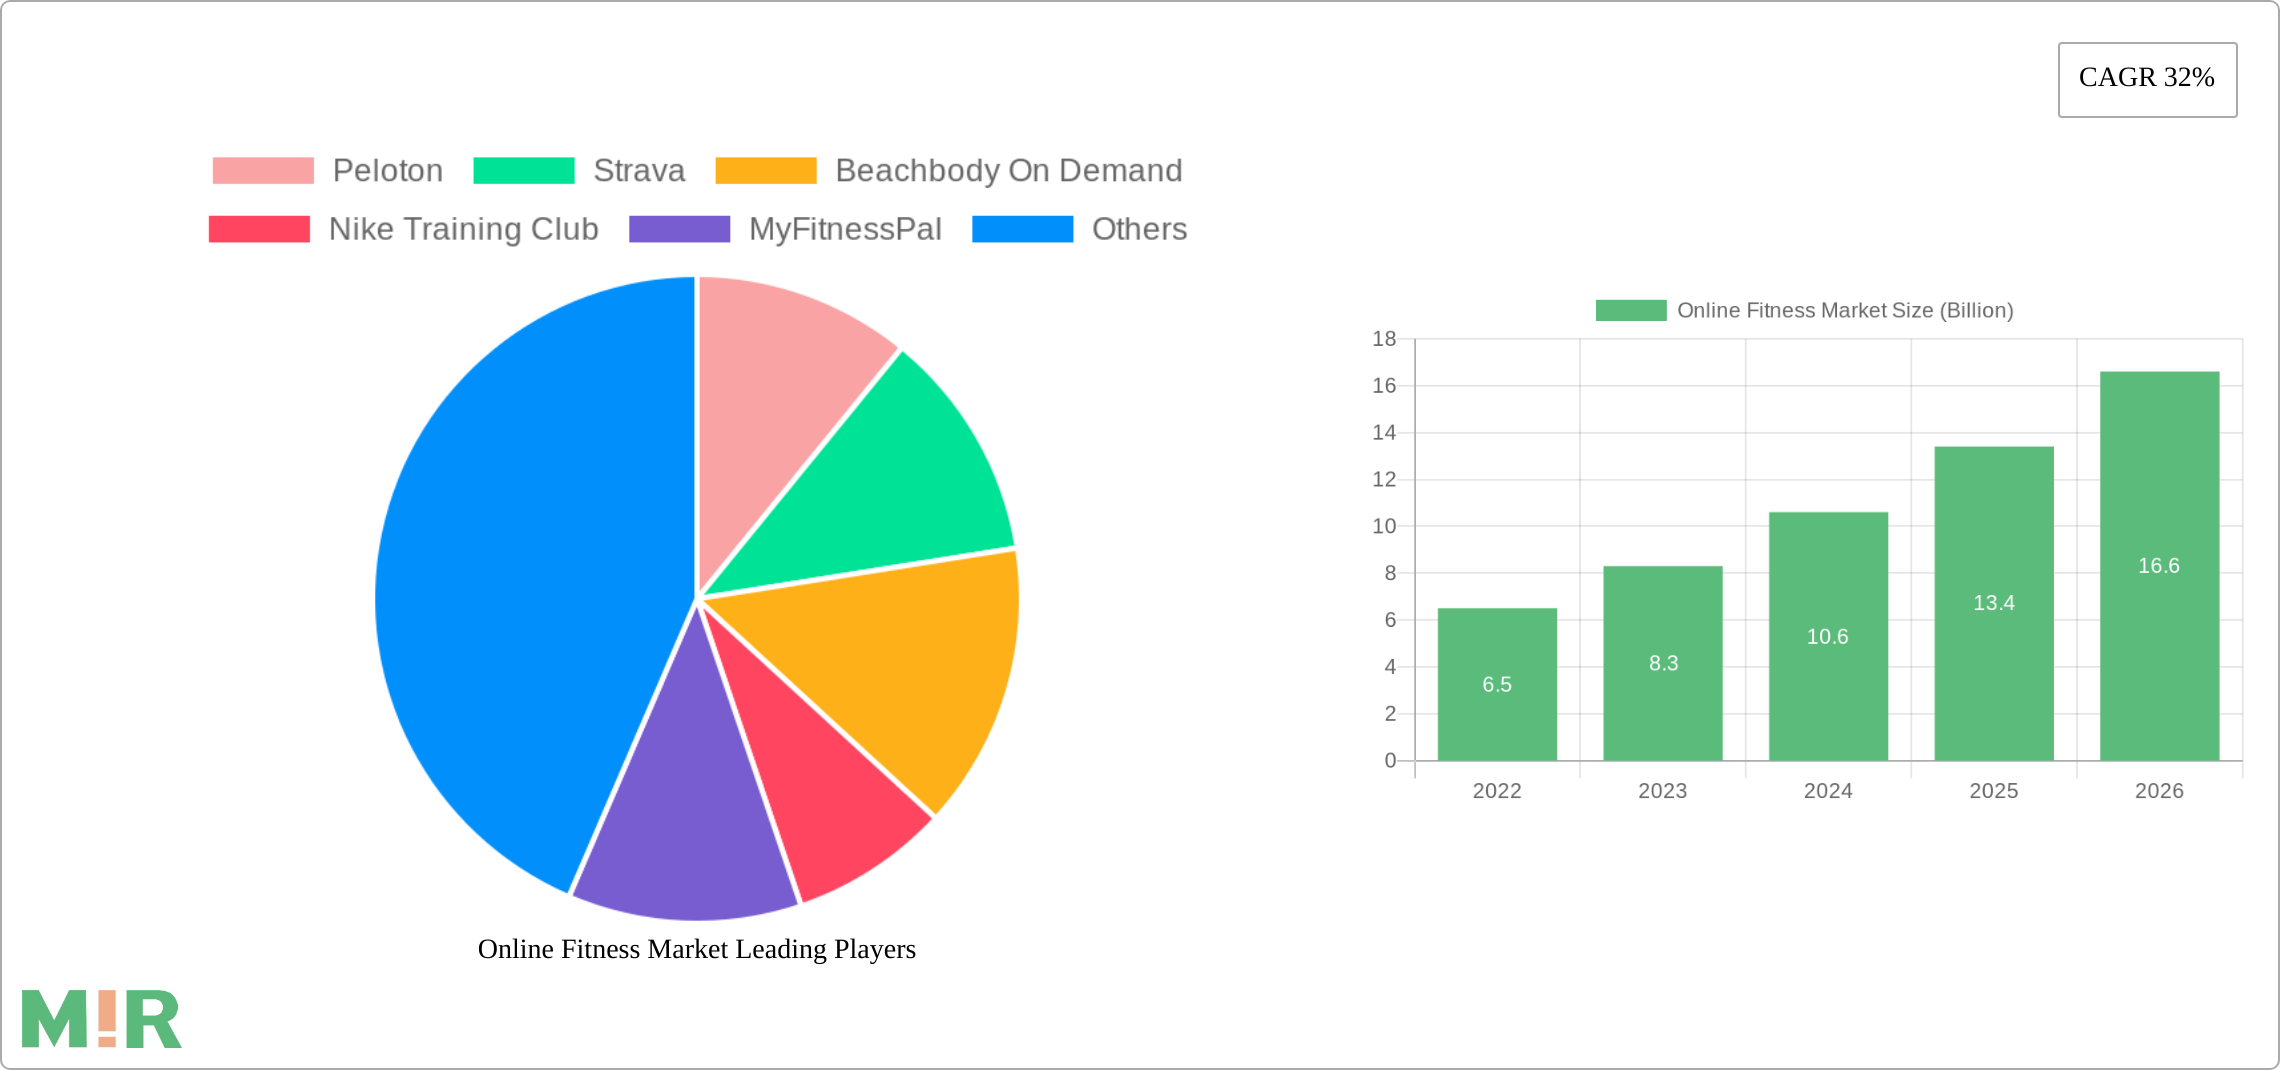
1. What is the projected Compound Annual Growth Rate (CAGR) of the Online Fitness Market?
The projected CAGR is approximately 32%.

Market
Insights
Reports delivered globally, covering a wide range of industries and sectors.
Clients who trust our expertise and rely on our insights for business decisions.
Managed Reports, ensuring seamless updates and premium service.
Satisfied Customers, committed to delivering exceptional value and quality.
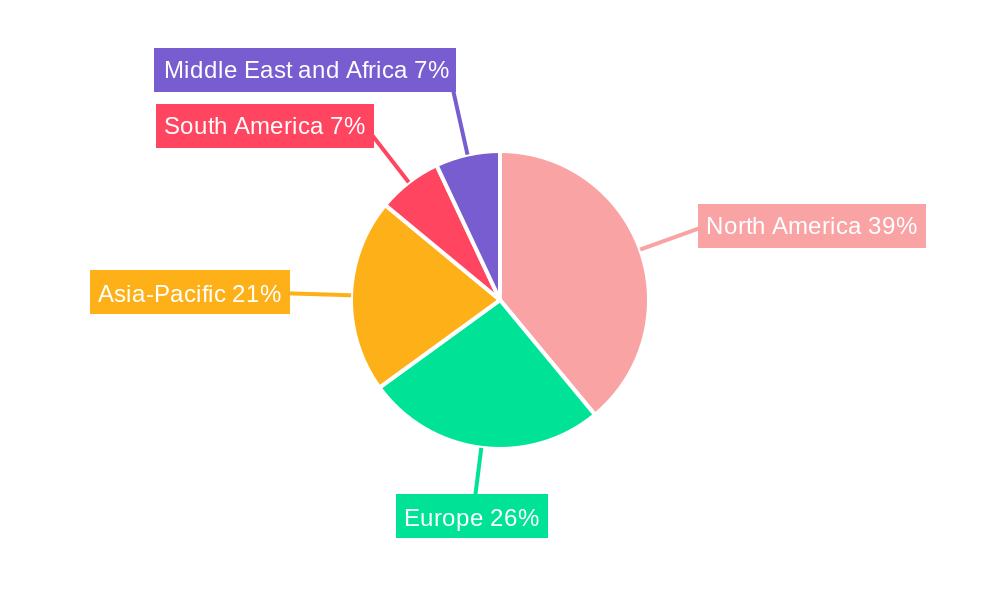
Online Fitness Market by Streaming Type (Live, On-demand), by Session (Group, Solo), by Technology (Mobile app, Desktop/Laptop, Smart TV), by Subscription Models (Pay-per class, Monthly subscription, Annual subscription), by End Use (Professional gyms, Educational & sports institutes, Individuals, Others), by North America (U.S., Canada), by Europe (UK, Germany, France, Italy, Spain, Russia, Nordics, Rest of Europe), by Asia Pacific (China, India, Japan, South Korea, ANZ, Southeast Asia, Rest of Asia Pacific), by Latin America (Brazil, Mexico, Argentina, Rest of Latin America), by MEA (UAE, Saudi Arabia, South Africa, Rest of MEA) Forecast 2025-2033
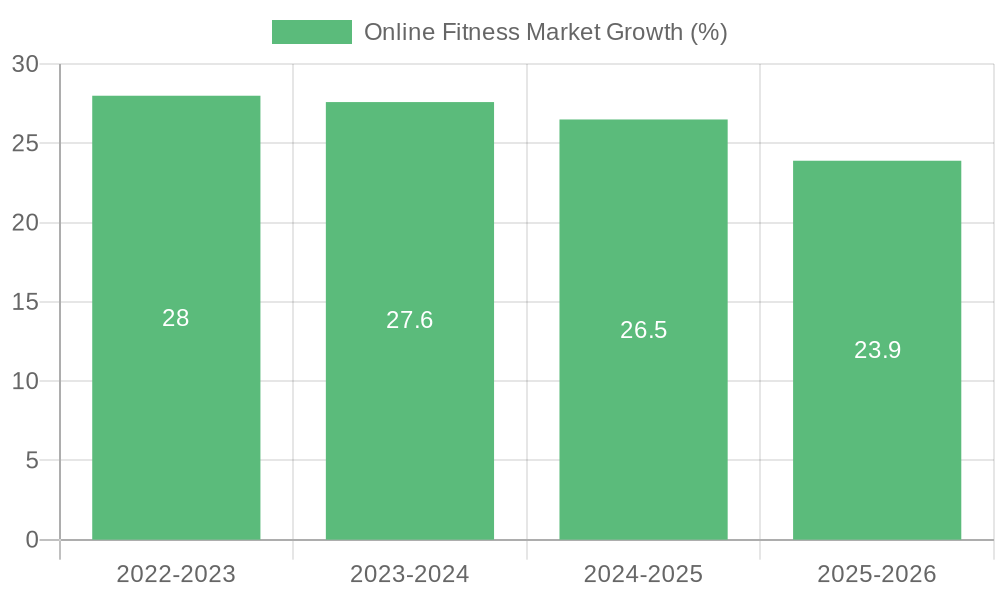
The size of the Online Fitness Market was valued at USD 15.5 Billion in 2024 and is projected to reach USD 108.23 Billion by 2033, with an expected CAGR of 32% during the forecast period. The Online Fitness Market aims to deliver fitness solutions and services via digital platforms, such as virtual workout classes, online personal training, fitness applications, and subscription-based exercise programs. This market has experienced notable growth, especially after the COVID-19 pandemic, which hastened the embrace of online fitness due to temporary closures of gyms and fitness centers. The need for convenience, flexibility, and accessibility has led to a rise in popularity of online fitness programs, enabling consumers to exercise from home or any location at any moment. Essential elements propelling the market consist of the surge in wearable fitness devices, social media influencers advocating fitness routines, and the increasing emphasis on health and well-being. Online fitness platforms accommodate a range of fitness levels and preferences, such as yoga, strength training, cardio, and mindfulness, offering choices for both novices and seasoned practitioners. With the market's ongoing expansion, there is a rising emphasis on tailored fitness programs, live-streamed classes, and features that promote community involvement. The Online Fitness Market is projected to grow further, propelled by technological improvements, heightened consumer health consciousness, and the ongoing demand for on-demand, adaptable fitness options.
The Online Fitness Market is concentrated with a few dominant players holding a significant market share. Key characteristics include:
The report provides comprehensive coverage of the Online Fitness Market, including:
The market size is estimated to reach $45 billion by 2028. Major players hold a significant market share, with constant innovation and acquisitions driving growth.
| Aspects | Details |
|---|---|
| Study Period | 2019-2033 |
| Base Year | 2024 |
| Estimated Year | 2025 |
| Forecast Period | 2025-2033 |
| Historical Period | 2019-2024 |
| Growth Rate | CAGR of 32% from 2019-2033 |
| Segmentation |
|


Note* : In applicable scenarios
Primary Research
Secondary Research

Involves using different sources of information in order to increase the validity of a study
These sources are likely to be stakeholders in a program - participants, other researchers, program staff, other community members, and so on.
Then we put all data in single framework & apply various statistical tools to find out the dynamic on the market.
During the analysis stage, feedback from the stakeholder groups would be compared to determine areas of agreement as well as areas of divergence
The projected CAGR is approximately 32%.
Key companies in the market include Peloton, Strava, Beachbody On Demand, Nike Training Club, MyFitnessPal, Fitbit Premium, Fitness Blender, Daily Burn, Obé Fitness, Tone It Up, Freeletics, Centr (Chris Hemsworth's fitness app), Apple Fitness+.
The market segments include Streaming Type, Session, Technology, Subscription Models, End Use.
The market size is estimated to be USD 15.5 Billion as of 2022.
Increased internet and smartphone penetration. Increasing advancements in technology. Growing focus on personalization. Increasing health awareness worldwide.
N/A
Technical issues. Retention and engagement.
In January 2024, Peloton partnered with TikTok to leverage the app's growing e-commerce capabilities. The collaboration involves producing TikTok videos featuring live classes, influencer partnerships, and celebrity collaborations, aiming to rebrand Peloton and attract a broader, younger audience through engaging social media content.
Pricing options include single-user, multi-user, and enterprise licenses priced at USD 4,850, USD 5,350, and USD 8,350 respectively.
The market size is provided in terms of value, measured in Billion and volume, measured in K Tons.
Yes, the market keyword associated with the report is "Online Fitness Market," which aids in identifying and referencing the specific market segment covered.
The pricing options vary based on user requirements and access needs. Individual users may opt for single-user licenses, while businesses requiring broader access may choose multi-user or enterprise licenses for cost-effective access to the report.
While the report offers comprehensive insights, it's advisable to review the specific contents or supplementary materials provided to ascertain if additional resources or data are available.
To stay informed about further developments, trends, and reports in the Online Fitness Market, consider subscribing to industry newsletters, following relevant companies and organizations, or regularly checking reputable industry news sources and publications.
See the similar reports
Market Insights Reports offers comprehensive market research reports and analysis, giving businesses important information about their clients, rivals, and sector to help them make well-informed decisions on operations, marketing, and business strategy. We offer a variety of services in addition to market research, data analysis, and strategy planning. In order to find opportunities and learn more about our competitors and the industry at large, we employ competitive analysis. To identify areas for development, we also evaluate our performance against that of our rivals. We can determine the places at which we can offer our clients the most value by performing value chain analysis.
Additionally, clients receive a thorough overview of their industry business environment. We can find trends that help us forecast future possibilities and threats by examining global macroeconomic dynamics and consumer behavior patterns. By analyzing their features and advantages, contrasting them with comparable items on the market, and evaluating both their quantitative and qualitative performance, we comprehensively evaluate our clients' products. This allows us to assist customers in determining how their goods compare to those of their rivals and in creating successful marketing plans. Our group has been successful in gaining a thorough grasp of our clients' requirements and offering them creative solutions. We currently provide services to more than 50 nations in Europe, the Middle East, Africa, Latin America, Asia Pacific, and North America. Because of our global reach, we have been able to establish trusting bonds with our partners and clients in various nations, improving customer service and forging a more cohesive worldwide presence.
We use cookies to enhance your experience.
By clicking "Accept All", you consent to the use of all cookies.
Customize your preferences or read our Cookie Policy.

