Report banner
On Grid PV Inverter Market
Updated On

Jul 29 2025

Total Pages

100

On Grid PV Inverter Market Navigating Dynamics Comprehensive Analysis and Forecasts 2025-2033

On Grid PV Inverter Market by Product (String, Micro, Central), by Phase (Single Phase, Three Phase), by Nominal Output Power (≤ 0.5 kW, 0.5 - 3 kW, 3 - 33 kW, 33 - 110 kW, > 110 kW), by Nominal Output Voltage (≤ 230 V, 230 - 400 V, 400 - 600 V, > 600 V), by Application (Residential, Commercial & Industrial, Utility), by North America (U.S., Canada), by Europe (Germany, Italy, Poland, Netherlands, Austria, UK, France), by Asia Pacific (China, Australia, India, Japan, South Korea), by Middle East & Africa (Israel, Saudi Arabia, UAE, South Africa), by Latin America (Brazil, Mexico, Chile) Forecast 2025-2033

Publisher Logo

On Grid PV Inverter Market Navigating Dynamics Comprehensive Analysis and Forecasts 2025-2033


Key Insights

The On Grid PV Inverter market benefits with the various advantages of the grid-connected PV system, including savings in electricity bills, a lower level of greenhouse gas emission, and better energy independence, and is increasingly growing. There is also governmental incentive for using renewable energy resources. The recent trend of the market is highly supported by an increased concern towards food security along with technological improvement. On Grid PV Inverters have been adopted widely across the different sectors such as residential, commercial, industrial, and utility scale solar power plants. Major players are Canadian Solar, Darfon Electronics Corp., Delta Electronics, Eaton, Enphase Energy, Fimer Group, GoodWe, Schneider Electric, among others who are spearheading innovation and the growth of this market through offering solutions that keep in tandem with the global demand for sustainable, cost-effective, and environmentally friendly energy generation.

On Grid PV Inverter Market Research Report - Market Size, Growth & Forecast

On Grid PV Inverter Market Concentration & Characteristics

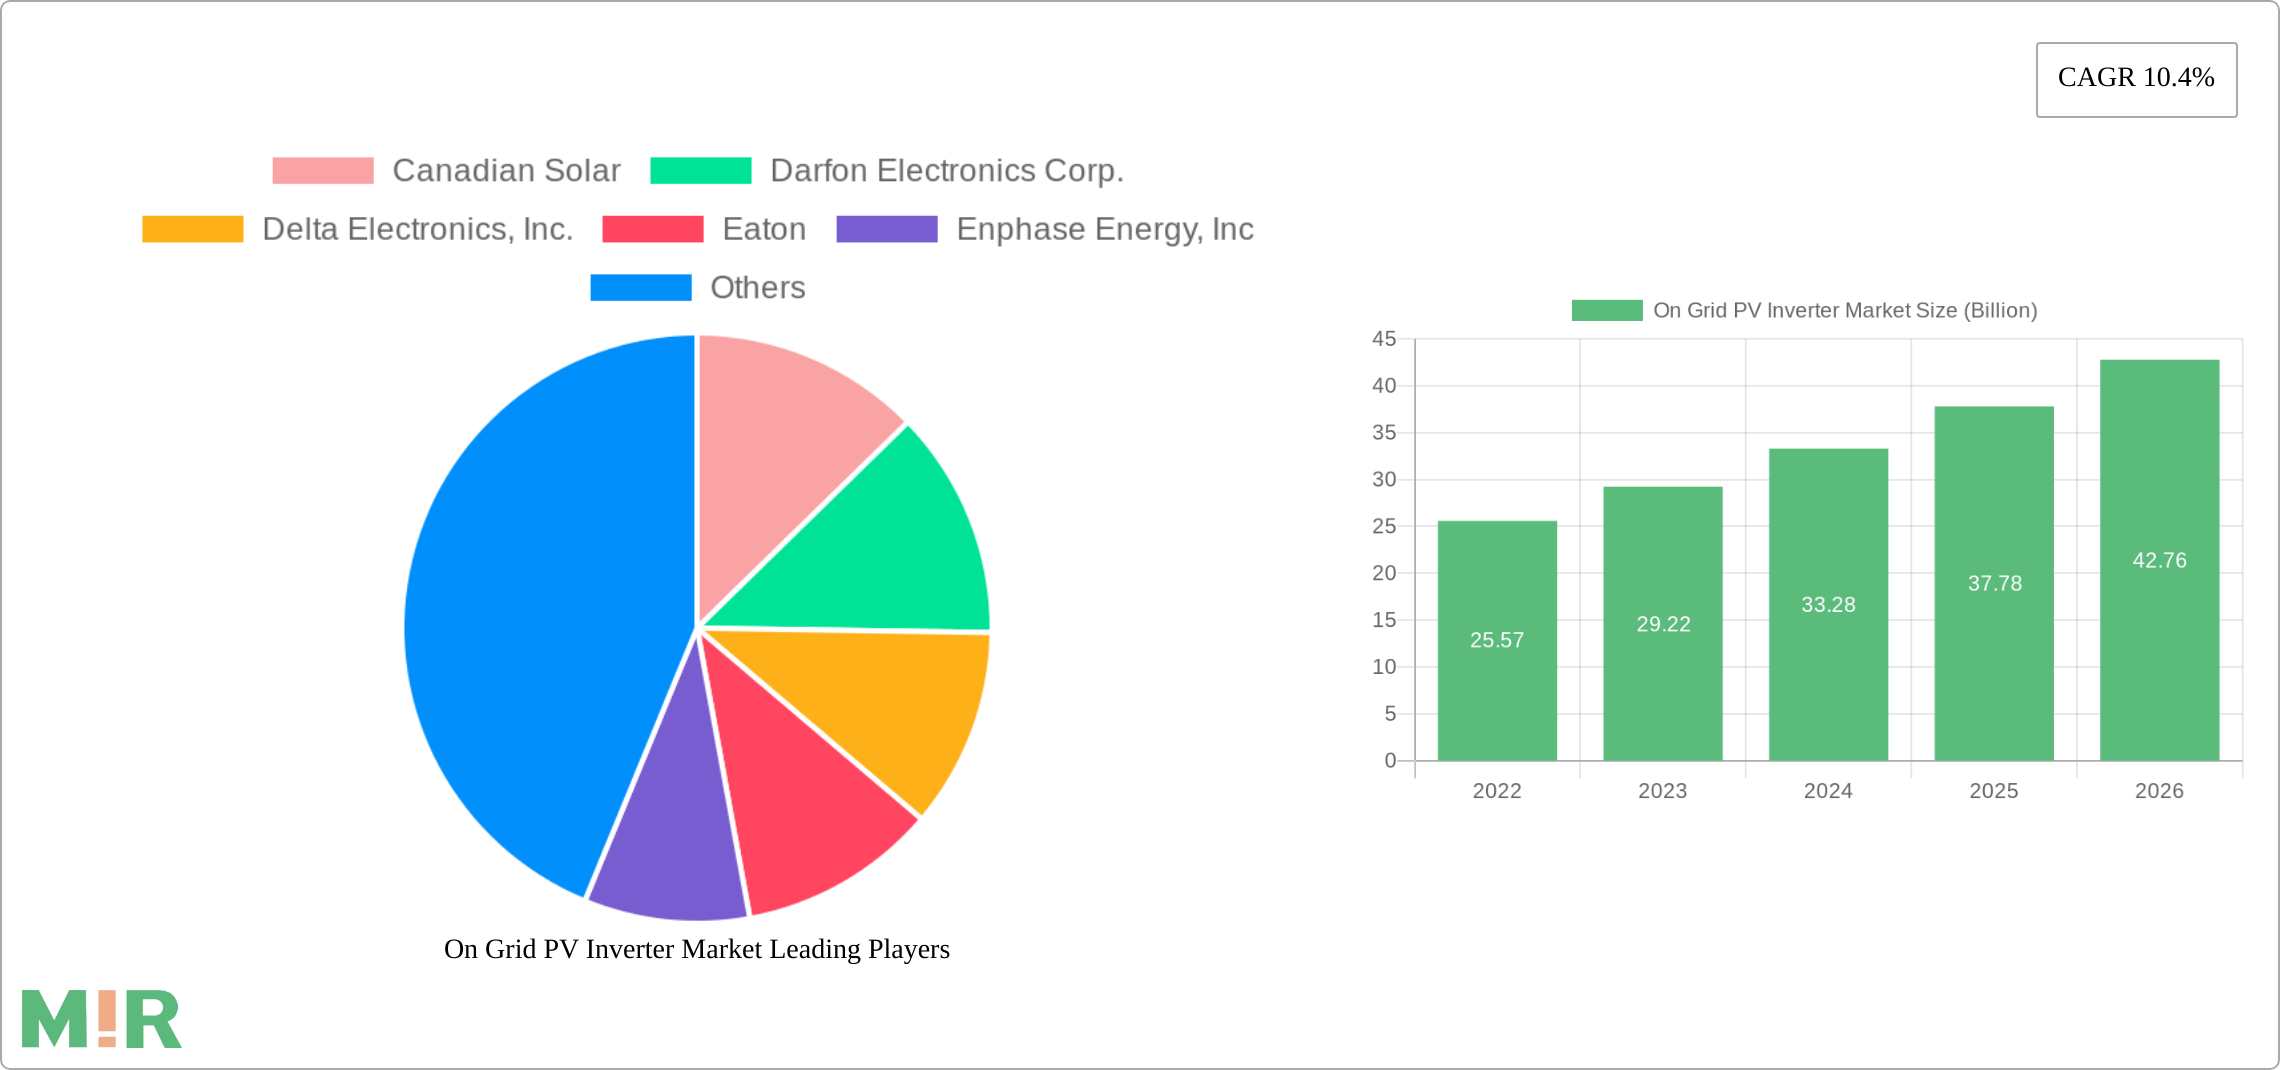
The On Grid PV Inverter market is a dynamic landscape characterized by a fragmented competitive structure with numerous global players vying for market share. Key participants include established industry giants such as Canadian Solar, Darfon Electronics Corp., Delta Electronics, Inc., Eaton, Enphase Energy, Inc., Fimer Group, GoodWe, Schneider Electric, Servotech Power Systems, SMA Solar Technology AG, Sungrow Power Supply Co., Ltd., Solis Inverters, SolarEdge Technologies, Inc., Statcon Energia, UTL Solar, and V-Guard Industries Ltd. This competitive intensity fuels innovation and drives the development of increasingly efficient and cost-effective inverter technologies.

Continuous innovation is a defining characteristic of this market. Research and development efforts are heavily focused on several key areas: boosting power conversion efficiency, enhancing seamless grid integration capabilities, and incorporating advanced functionalities such as sophisticated remote monitoring and control systems. These advancements not only improve performance but also enhance the reliability and overall value proposition of on-grid PV inverters.

Regulatory frameworks play a significant role in shaping market dynamics. Stringent safety standards and grid interconnection regulations directly influence product design, manufacturing processes, and ultimately, market access. Furthermore, government policies, including incentives and subsidies aimed at promoting renewable energy adoption, are crucial drivers of market demand and growth trajectories. The level of mergers and acquisitions (M&A) activity remains moderate, with strategic partnerships increasingly prevalent as companies seek to expand their product portfolios and geographical reach. End-user concentration is relatively low, reflecting the broad application of on-grid PV inverters across residential, commercial, and industrial sectors.

On Grid PV Inverter Market Trends

The On Grid PV Inverter Market is experiencing transformative trends driven by technological advancements, regulatory changes, and evolving consumer preferences.

Key market insights include the growing adoption of micro-inverters and string inverters. Micro-inverters gain traction due to their advantages of modularity, increased efficiency, and enhanced system reliability. String inverters remain the dominant technology due to their cost-effectiveness and ease of installation.

The integration of advanced digital technologies is another notable trend. The Internet of Things (IoT) enables remote monitoring and control of inverters, providing insights into system performance and optimizing energy production. Additionally, the integration of artificial intelligence (AI) and machine learning (ML) algorithms enhances inverter efficiency and grid stability.

Government initiatives and policies play a significant role in driving market growth. Renewable energy targets, subsidies, and tax incentives are encouraging the adoption of solar PV systems and, consequently, grid-tied inverters.

On Grid PV Inverter Market Growth

Key Region or Country & Segment to Dominate the Market

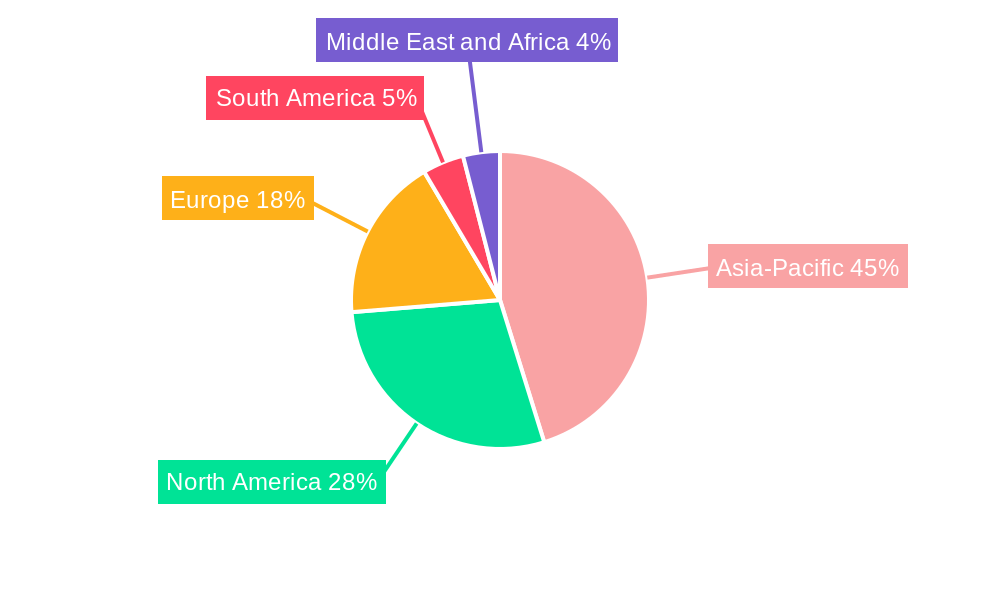
The Asia-Pacific region is projected to maintain its dominant position in the On Grid PV Inverter market throughout the forecast period, fueled by substantial growth in key markets such as China, India, and Japan. Rapid urbanization, supportive government initiatives, and favorable policies promoting solar energy adoption are the primary drivers of this regional market expansion. Within the market segmentation, the commercial and industrial sectors are anticipated to experience the most significant growth, driven by the escalating demand for renewable energy solutions within large-scale solar installations and high-energy consumption facilities. These sectors represent a prime market for the deployment of grid-tied inverters.

On Grid PV Inverter Market Product Insights Report Coverage & Deliverables

This comprehensive report includes a detailed analysis of the On Grid PV Inverter Market, covering various aspects of the market, including:

  • Market size and growth projections
  • Product types, applications, and regional segmentation
  • Competitive landscape and market share analysis
  • Industry trends and emerging technologies
  • Future prospects and growth opportunities
  • Key drivers, challenges, and restraints

On Grid PV Inverter Market Analysis

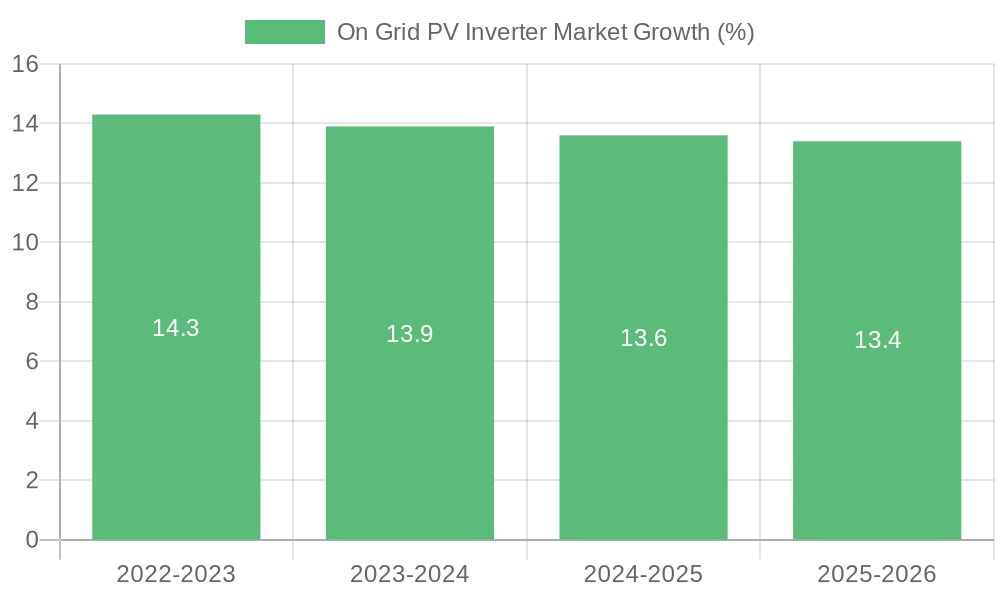
The On Grid PV Inverter Market has witnessed steady growth in recent years, with the market size projected to expand significantly over the forecast period. This growth is attributed to rising environmental concerns, government initiatives, and technological advancements.

The market is segmented based on product type, application, and region. String inverters currently hold the largest market share, followed by micro-inverters and central inverters. Residential, commercial, and industrial applications drive the market demand, with the commercial segment expected to experience the highest growth rate. Geographically, the Asia Pacific region dominates the market, while North America and Europe are other significant markets.

On Grid PV Inverter Market Regional Insights

North America: U.S., Canada
Europe: Germany, Italy, Poland, Netherlands, Austria, UK, France
Asia Pacific: China, Australia, India, Japan, South Korea
Middle East & Africa: Israel, Saudi Arabia, UAE, South Africa
Latin America: Brazil, Mexico, Chile

Driving Forces: What's Propelling the On Grid PV Inverter Market

  • The burgeoning global demand for renewable energy sources.
  • Supportive government policies and financial incentives designed to accelerate renewable energy adoption.
  • Continuous technological advancements leading to improved efficiency, reliability, and functionality of on-grid PV inverters.
  • Growing global awareness of environmental concerns and the urgent need to transition to sustainable energy solutions.

Challenges and Restraints in On Grid PV Inverter Market

  • High initial investment costs associated with the adoption of on-grid PV inverter systems.
  • Challenges related to seamless grid integration and ensuring compatibility with existing power grids.
  • A shortage of skilled labor and specialized expertise required for installation, maintenance, and servicing of these systems.

Emerging Trends in On Grid PV Inverter Market

  • Integration of IoT and AI
  • Blockchain technology for secure energy trading
  • Nano-inverters for increased efficiency

On Grid PV Inverter Industry News

  • In May 2024, Statcon Energia launched a 3 kW single-phase grid-tie solar inverter suitable for residential and small office applications.
  • In March 2024, GoodWe India announced a strategic partnership with Antyodaya Ujas to promote and distribute its solar inverters and energy storage solutions across West Bengal and Pan-India.

Leading Players in the On Grid PV Inverter Market Keyword

On Grid PV Inverter Market Segmentation

  • 1. Product
    • 1.1. String
    • 1.2. Micro
    • 1.3. Central
  • 2. Phase
    • 2.1. Single Phase
    • 2.2. Three Phase
  • 3. Nominal Output Power
    • 3.1. ≤ 0.5 kW
    • 3.2. 0.5 - 3 kW
    • 3.3. 3 - 33 kW
    • 3.4. 33 - 110 kW
    • 3.5. > 110 kW
  • 4. Nominal Output Voltage
    • 4.1. ≤ 230 V
    • 4.2. 230 - 400 V
    • 4.3. 400 - 600 V
    • 4.4. > 600 V
  • 5. Application
    • 5.1. Residential
    • 5.2. Commercial & Industrial
    • 5.3. Utility

On Grid PV Inverter Market Segmentation By Geography

  • 1. North America
    • 1.1. U.S.
    • 1.2. Canada
  • 2. Europe
    • 2.1. Germany
    • 2.2. Italy
    • 2.3. Poland
    • 2.4. Netherlands
    • 2.5. Austria
    • 2.6. UK
    • 2.7. France
  • 3. Asia Pacific
    • 3.1. China
    • 3.2. Australia
    • 3.3. India
    • 3.4. Japan
    • 3.5. South Korea
  • 4. Middle East & Africa
    • 4.1. Israel
    • 4.2. Saudi Arabia
    • 4.3. UAE
    • 4.4. South Africa
  • 5. Latin America
    • 5.1. Brazil
    • 5.2. Mexico
    • 5.3. Chile

On Grid PV Inverter Market Regional Share


On Grid PV Inverter Market REPORT HIGHLIGHTS

AspectsDetails
Study Period 2019-2033
Base Year 2024
Estimated Year 2025
Forecast Period2025-2033
Historical Period2019-2024
Growth RateCAGR of 10.4% from 2019-2033
Segmentation
    • By Product
      • String
      • Micro
      • Central
    • By Phase
      • Single Phase
      • Three Phase
    • By Nominal Output Power
      • ≤ 0.5 kW
      • 0.5 - 3 kW
      • 3 - 33 kW
      • 33 - 110 kW
      • > 110 kW
    • By Nominal Output Voltage
      • ≤ 230 V
      • 230 - 400 V
      • 400 - 600 V
      • > 600 V
    • By Application
      • Residential
      • Commercial & Industrial
      • Utility
  • By Geography
    • North America
      • U.S.
      • Canada
    • Europe
      • Germany
      • Italy
      • Poland
      • Netherlands
      • Austria
      • UK
      • France
    • Asia Pacific
      • China
      • Australia
      • India
      • Japan
      • South Korea
    • Middle East & Africa
      • Israel
      • Saudi Arabia
      • UAE
      • South Africa
    • Latin America
      • Brazil
      • Mexico
      • Chile


Table of Contents

  1. 1. Introduction
    • 1.1. Research Scope
    • 1.2. Market Segmentation
    • 1.3. Research Methodology
    • 1.4. Definitions and Assumptions
  2. 2. Executive Summary
    • 2.1. Introduction
  3. 3. Market Dynamics
    • 3.1. Introduction
      • 3.2. Market Drivers
        • 3.2.1 Increasing demand for renewable energy
        • 3.2.2 Growing regulatory support
        • 3.2.3 Rising environmental concerns and corporate sustainability
      • 3.3. Market Restrains
        • 3.3.1. Grid infrastructure challenges
      • 3.4. Market Trends
        • 3.4.1 The On Grid PV Inverter Market is experiencing transformative trends driven by technological advancements
        • 3.4.2 regulatory changes
        • 3.4.3 and evolving consumer preferences. Key market insights include the growing adoption of micro-inverters and string inverters. Micro-inverters gain traction due to their advantages of modularity
        • 3.4.4 increased efficiency
        • 3.4.5 and enhanced system reliability. String inverters remain the dominant technology due to their cost-effectiveness and ease of installation. The integration of advanced digital technologies is another notable trend. The Internet of Things (IoT) enables remote monitoring and control of inverters
        • 3.4.6 providing insights into system performance and optimizing energy production. Additionally
        • 3.4.7 the integration of artificial intelligence (AI) and machine learning (ML) algorithms enhances inverter efficiency and grid stability. Government initiatives and policies play a significant role in driving market growth. Renewable energy targets
        • 3.4.8 subsidies
        • 3.4.9 and tax incentives are encouraging the adoption of solar PV systems and
        • 3.4.10 consequently
        • 3.4.11 grid-tied inverters.
  4. 4. Market Factor Analysis
    • 4.1. Porters Five Forces
    • 4.2. Supply/Value Chain
    • 4.3. PESTEL analysis
    • 4.4. Market Entropy
    • 4.5. Patent/Trademark Analysis
  5. 5. Global On Grid PV Inverter Market Analysis, Insights and Forecast, 2019-2031
    • 5.1. Market Analysis, Insights and Forecast - by Product
      • 5.1.1. String
      • 5.1.2. Micro
      • 5.1.3. Central
    • 5.2. Market Analysis, Insights and Forecast - by Phase
      • 5.2.1. Single Phase
      • 5.2.2. Three Phase
    • 5.3. Market Analysis, Insights and Forecast - by Nominal Output Power
      • 5.3.1. ≤ 0.5 kW
      • 5.3.2. 0.5 - 3 kW
      • 5.3.3. 3 - 33 kW
      • 5.3.4. 33 - 110 kW
      • 5.3.5. > 110 kW
    • 5.4. Market Analysis, Insights and Forecast - by Nominal Output Voltage
      • 5.4.1. ≤ 230 V
      • 5.4.2. 230 - 400 V
      • 5.4.3. 400 - 600 V
      • 5.4.4. > 600 V
    • 5.5. Market Analysis, Insights and Forecast - by Application
      • 5.5.1. Residential
      • 5.5.2. Commercial & Industrial
      • 5.5.3. Utility
    • 5.6. Market Analysis, Insights and Forecast - by Region
      • 5.6.1. North America
      • 5.6.2. Europe
      • 5.6.3. Asia Pacific
      • 5.6.4. Middle East & Africa
      • 5.6.5. Latin America
  6. 6. North America On Grid PV Inverter Market Analysis, Insights and Forecast, 2019-2031
    • 6.1. Market Analysis, Insights and Forecast - by Product
      • 6.1.1. String
      • 6.1.2. Micro
      • 6.1.3. Central
    • 6.2. Market Analysis, Insights and Forecast - by Phase
      • 6.2.1. Single Phase
      • 6.2.2. Three Phase
    • 6.3. Market Analysis, Insights and Forecast - by Nominal Output Power
      • 6.3.1. ≤ 0.5 kW
      • 6.3.2. 0.5 - 3 kW
      • 6.3.3. 3 - 33 kW
      • 6.3.4. 33 - 110 kW
      • 6.3.5. > 110 kW
    • 6.4. Market Analysis, Insights and Forecast - by Nominal Output Voltage
      • 6.4.1. ≤ 230 V
      • 6.4.2. 230 - 400 V
      • 6.4.3. 400 - 600 V
      • 6.4.4. > 600 V
    • 6.5. Market Analysis, Insights and Forecast - by Application
      • 6.5.1. Residential
      • 6.5.2. Commercial & Industrial
      • 6.5.3. Utility
  7. 7. Europe On Grid PV Inverter Market Analysis, Insights and Forecast, 2019-2031
    • 7.1. Market Analysis, Insights and Forecast - by Product
      • 7.1.1. String
      • 7.1.2. Micro
      • 7.1.3. Central
    • 7.2. Market Analysis, Insights and Forecast - by Phase
      • 7.2.1. Single Phase
      • 7.2.2. Three Phase
    • 7.3. Market Analysis, Insights and Forecast - by Nominal Output Power
      • 7.3.1. ≤ 0.5 kW
      • 7.3.2. 0.5 - 3 kW
      • 7.3.3. 3 - 33 kW
      • 7.3.4. 33 - 110 kW
      • 7.3.5. > 110 kW
    • 7.4. Market Analysis, Insights and Forecast - by Nominal Output Voltage
      • 7.4.1. ≤ 230 V
      • 7.4.2. 230 - 400 V
      • 7.4.3. 400 - 600 V
      • 7.4.4. > 600 V
    • 7.5. Market Analysis, Insights and Forecast - by Application
      • 7.5.1. Residential
      • 7.5.2. Commercial & Industrial
      • 7.5.3. Utility
  8. 8. Asia Pacific On Grid PV Inverter Market Analysis, Insights and Forecast, 2019-2031
    • 8.1. Market Analysis, Insights and Forecast - by Product
      • 8.1.1. String
      • 8.1.2. Micro
      • 8.1.3. Central
    • 8.2. Market Analysis, Insights and Forecast - by Phase
      • 8.2.1. Single Phase
      • 8.2.2. Three Phase
    • 8.3. Market Analysis, Insights and Forecast - by Nominal Output Power
      • 8.3.1. ≤ 0.5 kW
      • 8.3.2. 0.5 - 3 kW
      • 8.3.3. 3 - 33 kW
      • 8.3.4. 33 - 110 kW
      • 8.3.5. > 110 kW
    • 8.4. Market Analysis, Insights and Forecast - by Nominal Output Voltage
      • 8.4.1. ≤ 230 V
      • 8.4.2. 230 - 400 V
      • 8.4.3. 400 - 600 V
      • 8.4.4. > 600 V
    • 8.5. Market Analysis, Insights and Forecast - by Application
      • 8.5.1. Residential
      • 8.5.2. Commercial & Industrial
      • 8.5.3. Utility
  9. 9. Middle East & Africa On Grid PV Inverter Market Analysis, Insights and Forecast, 2019-2031
    • 9.1. Market Analysis, Insights and Forecast - by Product
      • 9.1.1. String
      • 9.1.2. Micro
      • 9.1.3. Central
    • 9.2. Market Analysis, Insights and Forecast - by Phase
      • 9.2.1. Single Phase
      • 9.2.2. Three Phase
    • 9.3. Market Analysis, Insights and Forecast - by Nominal Output Power
      • 9.3.1. ≤ 0.5 kW
      • 9.3.2. 0.5 - 3 kW
      • 9.3.3. 3 - 33 kW
      • 9.3.4. 33 - 110 kW
      • 9.3.5. > 110 kW
    • 9.4. Market Analysis, Insights and Forecast - by Nominal Output Voltage
      • 9.4.1. ≤ 230 V
      • 9.4.2. 230 - 400 V
      • 9.4.3. 400 - 600 V
      • 9.4.4. > 600 V
    • 9.5. Market Analysis, Insights and Forecast - by Application
      • 9.5.1. Residential
      • 9.5.2. Commercial & Industrial
      • 9.5.3. Utility
  10. 10. Latin America On Grid PV Inverter Market Analysis, Insights and Forecast, 2019-2031
    • 10.1. Market Analysis, Insights and Forecast - by Product
      • 10.1.1. String
      • 10.1.2. Micro
      • 10.1.3. Central
    • 10.2. Market Analysis, Insights and Forecast - by Phase
      • 10.2.1. Single Phase
      • 10.2.2. Three Phase
    • 10.3. Market Analysis, Insights and Forecast - by Nominal Output Power
      • 10.3.1. ≤ 0.5 kW
      • 10.3.2. 0.5 - 3 kW
      • 10.3.3. 3 - 33 kW
      • 10.3.4. 33 - 110 kW
      • 10.3.5. > 110 kW
    • 10.4. Market Analysis, Insights and Forecast - by Nominal Output Voltage
      • 10.4.1. ≤ 230 V
      • 10.4.2. 230 - 400 V
      • 10.4.3. 400 - 600 V
      • 10.4.4. > 600 V
    • 10.5. Market Analysis, Insights and Forecast - by Application
      • 10.5.1. Residential
      • 10.5.2. Commercial & Industrial
      • 10.5.3. Utility
  11. 11. Competitive Analysis
    • 11.1. Global Market Share Analysis 2024
      • 11.2. Company Profiles
        • 11.2.1 Canadian Solar
          • 11.2.1.1. Overview
          • 11.2.1.2. Products
          • 11.2.1.3. SWOT Analysis
          • 11.2.1.4. Recent Developments
          • 11.2.1.5. Financials (Based on Availability)
        • 11.2.2 Darfon Electronics Corp.
          • 11.2.2.1. Overview
          • 11.2.2.2. Products
          • 11.2.2.3. SWOT Analysis
          • 11.2.2.4. Recent Developments
          • 11.2.2.5. Financials (Based on Availability)
        • 11.2.3 Delta Electronics Inc.
          • 11.2.3.1. Overview
          • 11.2.3.2. Products
          • 11.2.3.3. SWOT Analysis
          • 11.2.3.4. Recent Developments
          • 11.2.3.5. Financials (Based on Availability)
        • 11.2.4 Eaton
          • 11.2.4.1. Overview
          • 11.2.4.2. Products
          • 11.2.4.3. SWOT Analysis
          • 11.2.4.4. Recent Developments
          • 11.2.4.5. Financials (Based on Availability)
        • 11.2.5 Enphase Energy Inc
          • 11.2.5.1. Overview
          • 11.2.5.2. Products
          • 11.2.5.3. SWOT Analysis
          • 11.2.5.4. Recent Developments
          • 11.2.5.5. Financials (Based on Availability)
        • 11.2.6 Fimer Group
          • 11.2.6.1. Overview
          • 11.2.6.2. Products
          • 11.2.6.3. SWOT Analysis
          • 11.2.6.4. Recent Developments
          • 11.2.6.5. Financials (Based on Availability)
        • 11.2.7 GoodWe
          • 11.2.7.1. Overview
          • 11.2.7.2. Products
          • 11.2.7.3. SWOT Analysis
          • 11.2.7.4. Recent Developments
          • 11.2.7.5. Financials (Based on Availability)
        • 11.2.8 Schneider Electric
          • 11.2.8.1. Overview
          • 11.2.8.2. Products
          • 11.2.8.3. SWOT Analysis
          • 11.2.8.4. Recent Developments
          • 11.2.8.5. Financials (Based on Availability)
        • 11.2.9 Servotech Power Systems
          • 11.2.9.1. Overview
          • 11.2.9.2. Products
          • 11.2.9.3. SWOT Analysis
          • 11.2.9.4. Recent Developments
          • 11.2.9.5. Financials (Based on Availability)
        • 11.2.10 SMA Solar Technology AG
          • 11.2.10.1. Overview
          • 11.2.10.2. Products
          • 11.2.10.3. SWOT Analysis
          • 11.2.10.4. Recent Developments
          • 11.2.10.5. Financials (Based on Availability)
        • 11.2.11 Sungrow Power Supply Co. Ltd.
          • 11.2.11.1. Overview
          • 11.2.11.2. Products
          • 11.2.11.3. SWOT Analysis
          • 11.2.11.4. Recent Developments
          • 11.2.11.5. Financials (Based on Availability)
        • 11.2.12 Solis Inverters
          • 11.2.12.1. Overview
          • 11.2.12.2. Products
          • 11.2.12.3. SWOT Analysis
          • 11.2.12.4. Recent Developments
          • 11.2.12.5. Financials (Based on Availability)
        • 11.2.13 SolarEdge Technologies Inc.
          • 11.2.13.1. Overview
          • 11.2.13.2. Products
          • 11.2.13.3. SWOT Analysis
          • 11.2.13.4. Recent Developments
          • 11.2.13.5. Financials (Based on Availability)
        • 11.2.14 Statcon Energia
          • 11.2.14.1. Overview
          • 11.2.14.2. Products
          • 11.2.14.3. SWOT Analysis
          • 11.2.14.4. Recent Developments
          • 11.2.14.5. Financials (Based on Availability)
        • 11.2.15 UTL Solar
          • 11.2.15.1. Overview
          • 11.2.15.2. Products
          • 11.2.15.3. SWOT Analysis
          • 11.2.15.4. Recent Developments
          • 11.2.15.5. Financials (Based on Availability)
        • 11.2.16 V-Guard Industries Ltd
          • 11.2.16.1. Overview
          • 11.2.16.2. Products
          • 11.2.16.3. SWOT Analysis
          • 11.2.16.4. Recent Developments
          • 11.2.16.5. Financials (Based on Availability)

List of Figures

  1. Figure 1: Global On Grid PV Inverter Market Revenue Breakdown (Billion, %) by Region 2024 & 2032
  2. Figure 2: Global On Grid PV Inverter Market Volume Breakdown (units, %) by Region 2024 & 2032
  3. Figure 3: North America On Grid PV Inverter Market Revenue (Billion), by Product 2024 & 2032
  4. Figure 4: North America On Grid PV Inverter Market Volume (units), by Product 2024 & 2032
  5. Figure 5: North America On Grid PV Inverter Market Revenue Share (%), by Product 2024 & 2032
  6. Figure 6: North America On Grid PV Inverter Market Volume Share (%), by Product 2024 & 2032
  7. Figure 7: North America On Grid PV Inverter Market Revenue (Billion), by Phase 2024 & 2032
  8. Figure 8: North America On Grid PV Inverter Market Volume (units), by Phase 2024 & 2032
  9. Figure 9: North America On Grid PV Inverter Market Revenue Share (%), by Phase 2024 & 2032
  10. Figure 10: North America On Grid PV Inverter Market Volume Share (%), by Phase 2024 & 2032
  11. Figure 11: North America On Grid PV Inverter Market Revenue (Billion), by Nominal Output Power 2024 & 2032
  12. Figure 12: North America On Grid PV Inverter Market Volume (units), by Nominal Output Power 2024 & 2032
  13. Figure 13: North America On Grid PV Inverter Market Revenue Share (%), by Nominal Output Power 2024 & 2032
  14. Figure 14: North America On Grid PV Inverter Market Volume Share (%), by Nominal Output Power 2024 & 2032
  15. Figure 15: North America On Grid PV Inverter Market Revenue (Billion), by Nominal Output Voltage 2024 & 2032
  16. Figure 16: North America On Grid PV Inverter Market Volume (units), by Nominal Output Voltage 2024 & 2032
  17. Figure 17: North America On Grid PV Inverter Market Revenue Share (%), by Nominal Output Voltage 2024 & 2032
  18. Figure 18: North America On Grid PV Inverter Market Volume Share (%), by Nominal Output Voltage 2024 & 2032
  19. Figure 19: North America On Grid PV Inverter Market Revenue (Billion), by Application 2024 & 2032
  20. Figure 20: North America On Grid PV Inverter Market Volume (units), by Application 2024 & 2032
  21. Figure 21: North America On Grid PV Inverter Market Revenue Share (%), by Application 2024 & 2032
  22. Figure 22: North America On Grid PV Inverter Market Volume Share (%), by Application 2024 & 2032
  23. Figure 23: North America On Grid PV Inverter Market Revenue (Billion), by Country 2024 & 2032
  24. Figure 24: North America On Grid PV Inverter Market Volume (units), by Country 2024 & 2032
  25. Figure 25: North America On Grid PV Inverter Market Revenue Share (%), by Country 2024 & 2032
  26. Figure 26: North America On Grid PV Inverter Market Volume Share (%), by Country 2024 & 2032
  27. Figure 27: Europe On Grid PV Inverter Market Revenue (Billion), by Product 2024 & 2032
  28. Figure 28: Europe On Grid PV Inverter Market Volume (units), by Product 2024 & 2032
  29. Figure 29: Europe On Grid PV Inverter Market Revenue Share (%), by Product 2024 & 2032
  30. Figure 30: Europe On Grid PV Inverter Market Volume Share (%), by Product 2024 & 2032
  31. Figure 31: Europe On Grid PV Inverter Market Revenue (Billion), by Phase 2024 & 2032
  32. Figure 32: Europe On Grid PV Inverter Market Volume (units), by Phase 2024 & 2032
  33. Figure 33: Europe On Grid PV Inverter Market Revenue Share (%), by Phase 2024 & 2032
  34. Figure 34: Europe On Grid PV Inverter Market Volume Share (%), by Phase 2024 & 2032
  35. Figure 35: Europe On Grid PV Inverter Market Revenue (Billion), by Nominal Output Power 2024 & 2032
  36. Figure 36: Europe On Grid PV Inverter Market Volume (units), by Nominal Output Power 2024 & 2032
  37. Figure 37: Europe On Grid PV Inverter Market Revenue Share (%), by Nominal Output Power 2024 & 2032
  38. Figure 38: Europe On Grid PV Inverter Market Volume Share (%), by Nominal Output Power 2024 & 2032
  39. Figure 39: Europe On Grid PV Inverter Market Revenue (Billion), by Nominal Output Voltage 2024 & 2032
  40. Figure 40: Europe On Grid PV Inverter Market Volume (units), by Nominal Output Voltage 2024 & 2032
  41. Figure 41: Europe On Grid PV Inverter Market Revenue Share (%), by Nominal Output Voltage 2024 & 2032
  42. Figure 42: Europe On Grid PV Inverter Market Volume Share (%), by Nominal Output Voltage 2024 & 2032
  43. Figure 43: Europe On Grid PV Inverter Market Revenue (Billion), by Application 2024 & 2032
  44. Figure 44: Europe On Grid PV Inverter Market Volume (units), by Application 2024 & 2032
  45. Figure 45: Europe On Grid PV Inverter Market Revenue Share (%), by Application 2024 & 2032
  46. Figure 46: Europe On Grid PV Inverter Market Volume Share (%), by Application 2024 & 2032
  47. Figure 47: Europe On Grid PV Inverter Market Revenue (Billion), by Country 2024 & 2032
  48. Figure 48: Europe On Grid PV Inverter Market Volume (units), by Country 2024 & 2032
  49. Figure 49: Europe On Grid PV Inverter Market Revenue Share (%), by Country 2024 & 2032
  50. Figure 50: Europe On Grid PV Inverter Market Volume Share (%), by Country 2024 & 2032
  51. Figure 51: Asia Pacific On Grid PV Inverter Market Revenue (Billion), by Product 2024 & 2032
  52. Figure 52: Asia Pacific On Grid PV Inverter Market Volume (units), by Product 2024 & 2032
  53. Figure 53: Asia Pacific On Grid PV Inverter Market Revenue Share (%), by Product 2024 & 2032
  54. Figure 54: Asia Pacific On Grid PV Inverter Market Volume Share (%), by Product 2024 & 2032
  55. Figure 55: Asia Pacific On Grid PV Inverter Market Revenue (Billion), by Phase 2024 & 2032
  56. Figure 56: Asia Pacific On Grid PV Inverter Market Volume (units), by Phase 2024 & 2032
  57. Figure 57: Asia Pacific On Grid PV Inverter Market Revenue Share (%), by Phase 2024 & 2032
  58. Figure 58: Asia Pacific On Grid PV Inverter Market Volume Share (%), by Phase 2024 & 2032
  59. Figure 59: Asia Pacific On Grid PV Inverter Market Revenue (Billion), by Nominal Output Power 2024 & 2032
  60. Figure 60: Asia Pacific On Grid PV Inverter Market Volume (units), by Nominal Output Power 2024 & 2032
  61. Figure 61: Asia Pacific On Grid PV Inverter Market Revenue Share (%), by Nominal Output Power 2024 & 2032
  62. Figure 62: Asia Pacific On Grid PV Inverter Market Volume Share (%), by Nominal Output Power 2024 & 2032
  63. Figure 63: Asia Pacific On Grid PV Inverter Market Revenue (Billion), by Nominal Output Voltage 2024 & 2032
  64. Figure 64: Asia Pacific On Grid PV Inverter Market Volume (units), by Nominal Output Voltage 2024 & 2032
  65. Figure 65: Asia Pacific On Grid PV Inverter Market Revenue Share (%), by Nominal Output Voltage 2024 & 2032
  66. Figure 66: Asia Pacific On Grid PV Inverter Market Volume Share (%), by Nominal Output Voltage 2024 & 2032
  67. Figure 67: Asia Pacific On Grid PV Inverter Market Revenue (Billion), by Application 2024 & 2032
  68. Figure 68: Asia Pacific On Grid PV Inverter Market Volume (units), by Application 2024 & 2032
  69. Figure 69: Asia Pacific On Grid PV Inverter Market Revenue Share (%), by Application 2024 & 2032
  70. Figure 70: Asia Pacific On Grid PV Inverter Market Volume Share (%), by Application 2024 & 2032
  71. Figure 71: Asia Pacific On Grid PV Inverter Market Revenue (Billion), by Country 2024 & 2032
  72. Figure 72: Asia Pacific On Grid PV Inverter Market Volume (units), by Country 2024 & 2032
  73. Figure 73: Asia Pacific On Grid PV Inverter Market Revenue Share (%), by Country 2024 & 2032
  74. Figure 74: Asia Pacific On Grid PV Inverter Market Volume Share (%), by Country 2024 & 2032
  75. Figure 75: Middle East & Africa On Grid PV Inverter Market Revenue (Billion), by Product 2024 & 2032
  76. Figure 76: Middle East & Africa On Grid PV Inverter Market Volume (units), by Product 2024 & 2032
  77. Figure 77: Middle East & Africa On Grid PV Inverter Market Revenue Share (%), by Product 2024 & 2032
  78. Figure 78: Middle East & Africa On Grid PV Inverter Market Volume Share (%), by Product 2024 & 2032
  79. Figure 79: Middle East & Africa On Grid PV Inverter Market Revenue (Billion), by Phase 2024 & 2032
  80. Figure 80: Middle East & Africa On Grid PV Inverter Market Volume (units), by Phase 2024 & 2032
  81. Figure 81: Middle East & Africa On Grid PV Inverter Market Revenue Share (%), by Phase 2024 & 2032
  82. Figure 82: Middle East & Africa On Grid PV Inverter Market Volume Share (%), by Phase 2024 & 2032
  83. Figure 83: Middle East & Africa On Grid PV Inverter Market Revenue (Billion), by Nominal Output Power 2024 & 2032
  84. Figure 84: Middle East & Africa On Grid PV Inverter Market Volume (units), by Nominal Output Power 2024 & 2032
  85. Figure 85: Middle East & Africa On Grid PV Inverter Market Revenue Share (%), by Nominal Output Power 2024 & 2032
  86. Figure 86: Middle East & Africa On Grid PV Inverter Market Volume Share (%), by Nominal Output Power 2024 & 2032
  87. Figure 87: Middle East & Africa On Grid PV Inverter Market Revenue (Billion), by Nominal Output Voltage 2024 & 2032
  88. Figure 88: Middle East & Africa On Grid PV Inverter Market Volume (units), by Nominal Output Voltage 2024 & 2032
  89. Figure 89: Middle East & Africa On Grid PV Inverter Market Revenue Share (%), by Nominal Output Voltage 2024 & 2032
  90. Figure 90: Middle East & Africa On Grid PV Inverter Market Volume Share (%), by Nominal Output Voltage 2024 & 2032
  91. Figure 91: Middle East & Africa On Grid PV Inverter Market Revenue (Billion), by Application 2024 & 2032
  92. Figure 92: Middle East & Africa On Grid PV Inverter Market Volume (units), by Application 2024 & 2032
  93. Figure 93: Middle East & Africa On Grid PV Inverter Market Revenue Share (%), by Application 2024 & 2032
  94. Figure 94: Middle East & Africa On Grid PV Inverter Market Volume Share (%), by Application 2024 & 2032
  95. Figure 95: Middle East & Africa On Grid PV Inverter Market Revenue (Billion), by Country 2024 & 2032
  96. Figure 96: Middle East & Africa On Grid PV Inverter Market Volume (units), by Country 2024 & 2032
  97. Figure 97: Middle East & Africa On Grid PV Inverter Market Revenue Share (%), by Country 2024 & 2032
  98. Figure 98: Middle East & Africa On Grid PV Inverter Market Volume Share (%), by Country 2024 & 2032
  99. Figure 99: Latin America On Grid PV Inverter Market Revenue (Billion), by Product 2024 & 2032
  100. Figure 100: Latin America On Grid PV Inverter Market Volume (units), by Product 2024 & 2032
  101. Figure 101: Latin America On Grid PV Inverter Market Revenue Share (%), by Product 2024 & 2032
  102. Figure 102: Latin America On Grid PV Inverter Market Volume Share (%), by Product 2024 & 2032
  103. Figure 103: Latin America On Grid PV Inverter Market Revenue (Billion), by Phase 2024 & 2032
  104. Figure 104: Latin America On Grid PV Inverter Market Volume (units), by Phase 2024 & 2032
  105. Figure 105: Latin America On Grid PV Inverter Market Revenue Share (%), by Phase 2024 & 2032
  106. Figure 106: Latin America On Grid PV Inverter Market Volume Share (%), by Phase 2024 & 2032
  107. Figure 107: Latin America On Grid PV Inverter Market Revenue (Billion), by Nominal Output Power 2024 & 2032
  108. Figure 108: Latin America On Grid PV Inverter Market Volume (units), by Nominal Output Power 2024 & 2032
  109. Figure 109: Latin America On Grid PV Inverter Market Revenue Share (%), by Nominal Output Power 2024 & 2032
  110. Figure 110: Latin America On Grid PV Inverter Market Volume Share (%), by Nominal Output Power 2024 & 2032
  111. Figure 111: Latin America On Grid PV Inverter Market Revenue (Billion), by Nominal Output Voltage 2024 & 2032
  112. Figure 112: Latin America On Grid PV Inverter Market Volume (units), by Nominal Output Voltage 2024 & 2032
  113. Figure 113: Latin America On Grid PV Inverter Market Revenue Share (%), by Nominal Output Voltage 2024 & 2032
  114. Figure 114: Latin America On Grid PV Inverter Market Volume Share (%), by Nominal Output Voltage 2024 & 2032
  115. Figure 115: Latin America On Grid PV Inverter Market Revenue (Billion), by Application 2024 & 2032
  116. Figure 116: Latin America On Grid PV Inverter Market Volume (units), by Application 2024 & 2032
  117. Figure 117: Latin America On Grid PV Inverter Market Revenue Share (%), by Application 2024 & 2032
  118. Figure 118: Latin America On Grid PV Inverter Market Volume Share (%), by Application 2024 & 2032
  119. Figure 119: Latin America On Grid PV Inverter Market Revenue (Billion), by Country 2024 & 2032
  120. Figure 120: Latin America On Grid PV Inverter Market Volume (units), by Country 2024 & 2032
  121. Figure 121: Latin America On Grid PV Inverter Market Revenue Share (%), by Country 2024 & 2032
  122. Figure 122: Latin America On Grid PV Inverter Market Volume Share (%), by Country 2024 & 2032

List of Tables

  1. Table 1: Global On Grid PV Inverter Market Revenue Billion Forecast, by Region 2019 & 2032
  2. Table 2: Global On Grid PV Inverter Market Volume units Forecast, by Region 2019 & 2032
  3. Table 3: Global On Grid PV Inverter Market Revenue Billion Forecast, by Product 2019 & 2032
  4. Table 4: Global On Grid PV Inverter Market Volume units Forecast, by Product 2019 & 2032
  5. Table 5: Global On Grid PV Inverter Market Revenue Billion Forecast, by Phase 2019 & 2032
  6. Table 6: Global On Grid PV Inverter Market Volume units Forecast, by Phase 2019 & 2032
  7. Table 7: Global On Grid PV Inverter Market Revenue Billion Forecast, by Nominal Output Power 2019 & 2032
  8. Table 8: Global On Grid PV Inverter Market Volume units Forecast, by Nominal Output Power 2019 & 2032
  9. Table 9: Global On Grid PV Inverter Market Revenue Billion Forecast, by Nominal Output Voltage 2019 & 2032
  10. Table 10: Global On Grid PV Inverter Market Volume units Forecast, by Nominal Output Voltage 2019 & 2032
  11. Table 11: Global On Grid PV Inverter Market Revenue Billion Forecast, by Application 2019 & 2032
  12. Table 12: Global On Grid PV Inverter Market Volume units Forecast, by Application 2019 & 2032
  13. Table 13: Global On Grid PV Inverter Market Revenue Billion Forecast, by Region 2019 & 2032
  14. Table 14: Global On Grid PV Inverter Market Volume units Forecast, by Region 2019 & 2032
  15. Table 15: Global On Grid PV Inverter Market Revenue Billion Forecast, by Product 2019 & 2032
  16. Table 16: Global On Grid PV Inverter Market Volume units Forecast, by Product 2019 & 2032
  17. Table 17: Global On Grid PV Inverter Market Revenue Billion Forecast, by Phase 2019 & 2032
  18. Table 18: Global On Grid PV Inverter Market Volume units Forecast, by Phase 2019 & 2032
  19. Table 19: Global On Grid PV Inverter Market Revenue Billion Forecast, by Nominal Output Power 2019 & 2032
  20. Table 20: Global On Grid PV Inverter Market Volume units Forecast, by Nominal Output Power 2019 & 2032
  21. Table 21: Global On Grid PV Inverter Market Revenue Billion Forecast, by Nominal Output Voltage 2019 & 2032
  22. Table 22: Global On Grid PV Inverter Market Volume units Forecast, by Nominal Output Voltage 2019 & 2032
  23. Table 23: Global On Grid PV Inverter Market Revenue Billion Forecast, by Application 2019 & 2032
  24. Table 24: Global On Grid PV Inverter Market Volume units Forecast, by Application 2019 & 2032
  25. Table 25: Global On Grid PV Inverter Market Revenue Billion Forecast, by Country 2019 & 2032
  26. Table 26: Global On Grid PV Inverter Market Volume units Forecast, by Country 2019 & 2032
  27. Table 27: U.S. On Grid PV Inverter Market Revenue (Billion) Forecast, by Application 2019 & 2032
  28. Table 28: U.S. On Grid PV Inverter Market Volume (units) Forecast, by Application 2019 & 2032
  29. Table 29: Canada On Grid PV Inverter Market Revenue (Billion) Forecast, by Application 2019 & 2032
  30. Table 30: Canada On Grid PV Inverter Market Volume (units) Forecast, by Application 2019 & 2032
  31. Table 31: Global On Grid PV Inverter Market Revenue Billion Forecast, by Product 2019 & 2032
  32. Table 32: Global On Grid PV Inverter Market Volume units Forecast, by Product 2019 & 2032
  33. Table 33: Global On Grid PV Inverter Market Revenue Billion Forecast, by Phase 2019 & 2032
  34. Table 34: Global On Grid PV Inverter Market Volume units Forecast, by Phase 2019 & 2032
  35. Table 35: Global On Grid PV Inverter Market Revenue Billion Forecast, by Nominal Output Power 2019 & 2032
  36. Table 36: Global On Grid PV Inverter Market Volume units Forecast, by Nominal Output Power 2019 & 2032
  37. Table 37: Global On Grid PV Inverter Market Revenue Billion Forecast, by Nominal Output Voltage 2019 & 2032
  38. Table 38: Global On Grid PV Inverter Market Volume units Forecast, by Nominal Output Voltage 2019 & 2032
  39. Table 39: Global On Grid PV Inverter Market Revenue Billion Forecast, by Application 2019 & 2032
  40. Table 40: Global On Grid PV Inverter Market Volume units Forecast, by Application 2019 & 2032
  41. Table 41: Global On Grid PV Inverter Market Revenue Billion Forecast, by Country 2019 & 2032
  42. Table 42: Global On Grid PV Inverter Market Volume units Forecast, by Country 2019 & 2032
  43. Table 43: Germany On Grid PV Inverter Market Revenue (Billion) Forecast, by Application 2019 & 2032
  44. Table 44: Germany On Grid PV Inverter Market Volume (units) Forecast, by Application 2019 & 2032
  45. Table 45: Italy On Grid PV Inverter Market Revenue (Billion) Forecast, by Application 2019 & 2032
  46. Table 46: Italy On Grid PV Inverter Market Volume (units) Forecast, by Application 2019 & 2032
  47. Table 47: Poland On Grid PV Inverter Market Revenue (Billion) Forecast, by Application 2019 & 2032
  48. Table 48: Poland On Grid PV Inverter Market Volume (units) Forecast, by Application 2019 & 2032
  49. Table 49: Netherlands On Grid PV Inverter Market Revenue (Billion) Forecast, by Application 2019 & 2032
  50. Table 50: Netherlands On Grid PV Inverter Market Volume (units) Forecast, by Application 2019 & 2032
  51. Table 51: Austria On Grid PV Inverter Market Revenue (Billion) Forecast, by Application 2019 & 2032
  52. Table 52: Austria On Grid PV Inverter Market Volume (units) Forecast, by Application 2019 & 2032
  53. Table 53: UK On Grid PV Inverter Market Revenue (Billion) Forecast, by Application 2019 & 2032
  54. Table 54: UK On Grid PV Inverter Market Volume (units) Forecast, by Application 2019 & 2032
  55. Table 55: France On Grid PV Inverter Market Revenue (Billion) Forecast, by Application 2019 & 2032
  56. Table 56: France On Grid PV Inverter Market Volume (units) Forecast, by Application 2019 & 2032
  57. Table 57: Global On Grid PV Inverter Market Revenue Billion Forecast, by Product 2019 & 2032
  58. Table 58: Global On Grid PV Inverter Market Volume units Forecast, by Product 2019 & 2032
  59. Table 59: Global On Grid PV Inverter Market Revenue Billion Forecast, by Phase 2019 & 2032
  60. Table 60: Global On Grid PV Inverter Market Volume units Forecast, by Phase 2019 & 2032
  61. Table 61: Global On Grid PV Inverter Market Revenue Billion Forecast, by Nominal Output Power 2019 & 2032
  62. Table 62: Global On Grid PV Inverter Market Volume units Forecast, by Nominal Output Power 2019 & 2032
  63. Table 63: Global On Grid PV Inverter Market Revenue Billion Forecast, by Nominal Output Voltage 2019 & 2032
  64. Table 64: Global On Grid PV Inverter Market Volume units Forecast, by Nominal Output Voltage 2019 & 2032
  65. Table 65: Global On Grid PV Inverter Market Revenue Billion Forecast, by Application 2019 & 2032
  66. Table 66: Global On Grid PV Inverter Market Volume units Forecast, by Application 2019 & 2032
  67. Table 67: Global On Grid PV Inverter Market Revenue Billion Forecast, by Country 2019 & 2032
  68. Table 68: Global On Grid PV Inverter Market Volume units Forecast, by Country 2019 & 2032
  69. Table 69: China On Grid PV Inverter Market Revenue (Billion) Forecast, by Application 2019 & 2032
  70. Table 70: China On Grid PV Inverter Market Volume (units) Forecast, by Application 2019 & 2032
  71. Table 71: Australia On Grid PV Inverter Market Revenue (Billion) Forecast, by Application 2019 & 2032
  72. Table 72: Australia On Grid PV Inverter Market Volume (units) Forecast, by Application 2019 & 2032
  73. Table 73: India On Grid PV Inverter Market Revenue (Billion) Forecast, by Application 2019 & 2032
  74. Table 74: India On Grid PV Inverter Market Volume (units) Forecast, by Application 2019 & 2032
  75. Table 75: Japan On Grid PV Inverter Market Revenue (Billion) Forecast, by Application 2019 & 2032
  76. Table 76: Japan On Grid PV Inverter Market Volume (units) Forecast, by Application 2019 & 2032
  77. Table 77: South Korea On Grid PV Inverter Market Revenue (Billion) Forecast, by Application 2019 & 2032
  78. Table 78: South Korea On Grid PV Inverter Market Volume (units) Forecast, by Application 2019 & 2032
  79. Table 79: Global On Grid PV Inverter Market Revenue Billion Forecast, by Product 2019 & 2032
  80. Table 80: Global On Grid PV Inverter Market Volume units Forecast, by Product 2019 & 2032
  81. Table 81: Global On Grid PV Inverter Market Revenue Billion Forecast, by Phase 2019 & 2032
  82. Table 82: Global On Grid PV Inverter Market Volume units Forecast, by Phase 2019 & 2032
  83. Table 83: Global On Grid PV Inverter Market Revenue Billion Forecast, by Nominal Output Power 2019 & 2032
  84. Table 84: Global On Grid PV Inverter Market Volume units Forecast, by Nominal Output Power 2019 & 2032
  85. Table 85: Global On Grid PV Inverter Market Revenue Billion Forecast, by Nominal Output Voltage 2019 & 2032
  86. Table 86: Global On Grid PV Inverter Market Volume units Forecast, by Nominal Output Voltage 2019 & 2032
  87. Table 87: Global On Grid PV Inverter Market Revenue Billion Forecast, by Application 2019 & 2032
  88. Table 88: Global On Grid PV Inverter Market Volume units Forecast, by Application 2019 & 2032
  89. Table 89: Global On Grid PV Inverter Market Revenue Billion Forecast, by Country 2019 & 2032
  90. Table 90: Global On Grid PV Inverter Market Volume units Forecast, by Country 2019 & 2032
  91. Table 91: Israel On Grid PV Inverter Market Revenue (Billion) Forecast, by Application 2019 & 2032
  92. Table 92: Israel On Grid PV Inverter Market Volume (units) Forecast, by Application 2019 & 2032
  93. Table 93: Saudi Arabia On Grid PV Inverter Market Revenue (Billion) Forecast, by Application 2019 & 2032
  94. Table 94: Saudi Arabia On Grid PV Inverter Market Volume (units) Forecast, by Application 2019 & 2032
  95. Table 95: UAE On Grid PV Inverter Market Revenue (Billion) Forecast, by Application 2019 & 2032
  96. Table 96: UAE On Grid PV Inverter Market Volume (units) Forecast, by Application 2019 & 2032
  97. Table 97: South Africa On Grid PV Inverter Market Revenue (Billion) Forecast, by Application 2019 & 2032
  98. Table 98: South Africa On Grid PV Inverter Market Volume (units) Forecast, by Application 2019 & 2032
  99. Table 99: Global On Grid PV Inverter Market Revenue Billion Forecast, by Product 2019 & 2032
  100. Table 100: Global On Grid PV Inverter Market Volume units Forecast, by Product 2019 & 2032
  101. Table 101: Global On Grid PV Inverter Market Revenue Billion Forecast, by Phase 2019 & 2032
  102. Table 102: Global On Grid PV Inverter Market Volume units Forecast, by Phase 2019 & 2032
  103. Table 103: Global On Grid PV Inverter Market Revenue Billion Forecast, by Nominal Output Power 2019 & 2032
  104. Table 104: Global On Grid PV Inverter Market Volume units Forecast, by Nominal Output Power 2019 & 2032
  105. Table 105: Global On Grid PV Inverter Market Revenue Billion Forecast, by Nominal Output Voltage 2019 & 2032
  106. Table 106: Global On Grid PV Inverter Market Volume units Forecast, by Nominal Output Voltage 2019 & 2032
  107. Table 107: Global On Grid PV Inverter Market Revenue Billion Forecast, by Application 2019 & 2032
  108. Table 108: Global On Grid PV Inverter Market Volume units Forecast, by Application 2019 & 2032
  109. Table 109: Global On Grid PV Inverter Market Revenue Billion Forecast, by Country 2019 & 2032
  110. Table 110: Global On Grid PV Inverter Market Volume units Forecast, by Country 2019 & 2032
  111. Table 111: Brazil On Grid PV Inverter Market Revenue (Billion) Forecast, by Application 2019 & 2032
  112. Table 112: Brazil On Grid PV Inverter Market Volume (units) Forecast, by Application 2019 & 2032
  113. Table 113: Mexico On Grid PV Inverter Market Revenue (Billion) Forecast, by Application 2019 & 2032
  114. Table 114: Mexico On Grid PV Inverter Market Volume (units) Forecast, by Application 2019 & 2032
  115. Table 115: Chile On Grid PV Inverter Market Revenue (Billion) Forecast, by Application 2019 & 2032
  116. Table 116: Chile On Grid PV Inverter Market Volume (units) Forecast, by Application 2019 & 2032


STEP 1 - Identification of Relevant Samples Size from Population Database

Step Chart
bar chart
method chart

STEP 2 - Approaches for Defining Global Market Size (Value, Volume* & Price*)

approach chart
Top-down and bottom-up approaches are used to validate the global market size and estimate the market size for manufactures, regional segemnts, product and application.

Note* : In applicable scenarios

STEP 3 - Data Sources

Primary Research

  • Web Analytics
  • Survey Reports
  • Research Institute
  • Latest Research Reports
  • Opinion Leaders

Secondary Research

  • Annual Reports
  • White Paper
  • Latest Press Release
  • Industry Association
  • Paid Database
  • Investor Presentations
approach chart

STEP 4 - Data Triangulation

Involves using different sources of information in order to increase the validity of a study

These sources are likely to be stakeholders in a program - participants, other researchers, program staff, other community members, and so on.

Then we put all data in single framework & apply various statistical tools to find out the dynamic on the market.

During the analysis stage, feedback from the stakeholder groups would be compared to determine areas of agreement as well as areas of divergence

Additionally after gathering mix and scattered data from wide range of sources, data is triangull- ated and correlated to come up with estimated figures which are further validated through primary mediums, or industry experts, opinion leader.

Frequently Asked Questions

1. What is the projected Compound Annual Growth Rate (CAGR) of the On Grid PV Inverter Market?

The projected CAGR is approximately 10.4%.

2. Which companies are prominent players in the On Grid PV Inverter Market?

Key companies in the market include Canadian Solar, Darfon Electronics Corp., Delta Electronics, Inc., Eaton, Enphase Energy, Inc, Fimer Group, GoodWe, Schneider Electric, Servotech Power Systems, SMA Solar Technology AG, Sungrow Power Supply Co., Ltd., Solis Inverters, SolarEdge Technologies, Inc., Statcon Energia, UTL Solar, V-Guard Industries Ltd.

3. What are the main segments of the On Grid PV Inverter Market?

The market segments include Product, Phase, Nominal Output Power, Nominal Output Voltage, Application.

4. Can you provide details about the market size?

The market size is estimated to be USD 25.7 Billion as of 2022.

5. What are some drivers contributing to market growth?

Increasing demand for renewable energy. Growing regulatory support. Rising environmental concerns and corporate sustainability.

6. What are the notable trends driving market growth?

The On Grid PV Inverter Market is experiencing transformative trends driven by technological advancements. regulatory changes. and evolving consumer preferences. Key market insights include the growing adoption of micro-inverters and string inverters. Micro-inverters gain traction due to their advantages of modularity. increased efficiency. and enhanced system reliability. String inverters remain the dominant technology due to their cost-effectiveness and ease of installation. The integration of advanced digital technologies is another notable trend. The Internet of Things (IoT) enables remote monitoring and control of inverters. providing insights into system performance and optimizing energy production. Additionally. the integration of artificial intelligence (AI) and machine learning (ML) algorithms enhances inverter efficiency and grid stability. Government initiatives and policies play a significant role in driving market growth. Renewable energy targets. subsidies. and tax incentives are encouraging the adoption of solar PV systems and. consequently. grid-tied inverters..

7. Are there any restraints impacting market growth?

Grid infrastructure challenges.

8. Can you provide examples of recent developments in the market?

In May 2024, Statcon Energiaa has launched a 3 kW single-phase grid-tie solar inverter suitable for residential and small office applications. The inverter holds advanced features such as MPPT for enhanced solar generation, remote monitoring with WiFi, and robust anti-islanding protection, ensuring efficient and safe operation. With this product launch, the company aims to expand its customer base and presence in the Indian PV inverter market.

9. What pricing options are available for accessing the report?

Pricing options include single-user, multi-user, and enterprise licenses priced at USD 4,850, USD 5,350, and USD 8,350 respectively.

10. Is the market size provided in terms of value or volume?

The market size is provided in terms of value, measured in Billion and volume, measured in units.

11. Are there any specific market keywords associated with the report?

Yes, the market keyword associated with the report is "On Grid PV Inverter Market," which aids in identifying and referencing the specific market segment covered.

12. How do I determine which pricing option suits my needs best?

The pricing options vary based on user requirements and access needs. Individual users may opt for single-user licenses, while businesses requiring broader access may choose multi-user or enterprise licenses for cost-effective access to the report.

13. Are there any additional resources or data provided in the On Grid PV Inverter Market report?

While the report offers comprehensive insights, it's advisable to review the specific contents or supplementary materials provided to ascertain if additional resources or data are available.

14. How can I stay updated on further developments or reports in the On Grid PV Inverter Market?

To stay informed about further developments, trends, and reports in the On Grid PV Inverter Market, consider subscribing to industry newsletters, following relevant companies and organizations, or regularly checking reputable industry news sources and publications.

Discover the Latest Market Insight Reports

Access in-depth insights on industries, companies, trends, and global markets. Our expertly curated reports provide the most relevant data and analysis in a condensed, easy-to-read format.

shop image 1

About Market Insights Report

Market Insights Reports offers comprehensive market research reports and analysis, giving businesses important information about their clients, rivals, and sector to help them make well-informed decisions on operations, marketing, and business strategy. We offer a variety of services in addition to market research, data analysis, and strategy planning. In order to find opportunities and learn more about our competitors and the industry at large, we employ competitive analysis. To identify areas for development, we also evaluate our performance against that of our rivals. We can determine the places at which we can offer our clients the most value by performing value chain analysis.

Additionally, clients receive a thorough overview of their industry business environment. We can find trends that help us forecast future possibilities and threats by examining global macroeconomic dynamics and consumer behavior patterns. By analyzing their features and advantages, contrasting them with comparable items on the market, and evaluating both their quantitative and qualitative performance, we comprehensively evaluate our clients' products. This allows us to assist customers in determining how their goods compare to those of their rivals and in creating successful marketing plans. Our group has been successful in gaining a thorough grasp of our clients' requirements and offering them creative solutions. We currently provide services to more than 50 nations in Europe, the Middle East, Africa, Latin America, Asia Pacific, and North America. Because of our global reach, we have been able to establish trusting bonds with our partners and clients in various nations, improving customer service and forging a more cohesive worldwide presence.

We use cookies to enhance your experience.

By clicking "Accept All", you consent to the use of all cookies.

Customize your preferences or read our Cookie Policy.