.jpg&w=3840&q=100)
1. What is the projected Compound Annual Growth Rate (CAGR) of the 5G NTN Market?
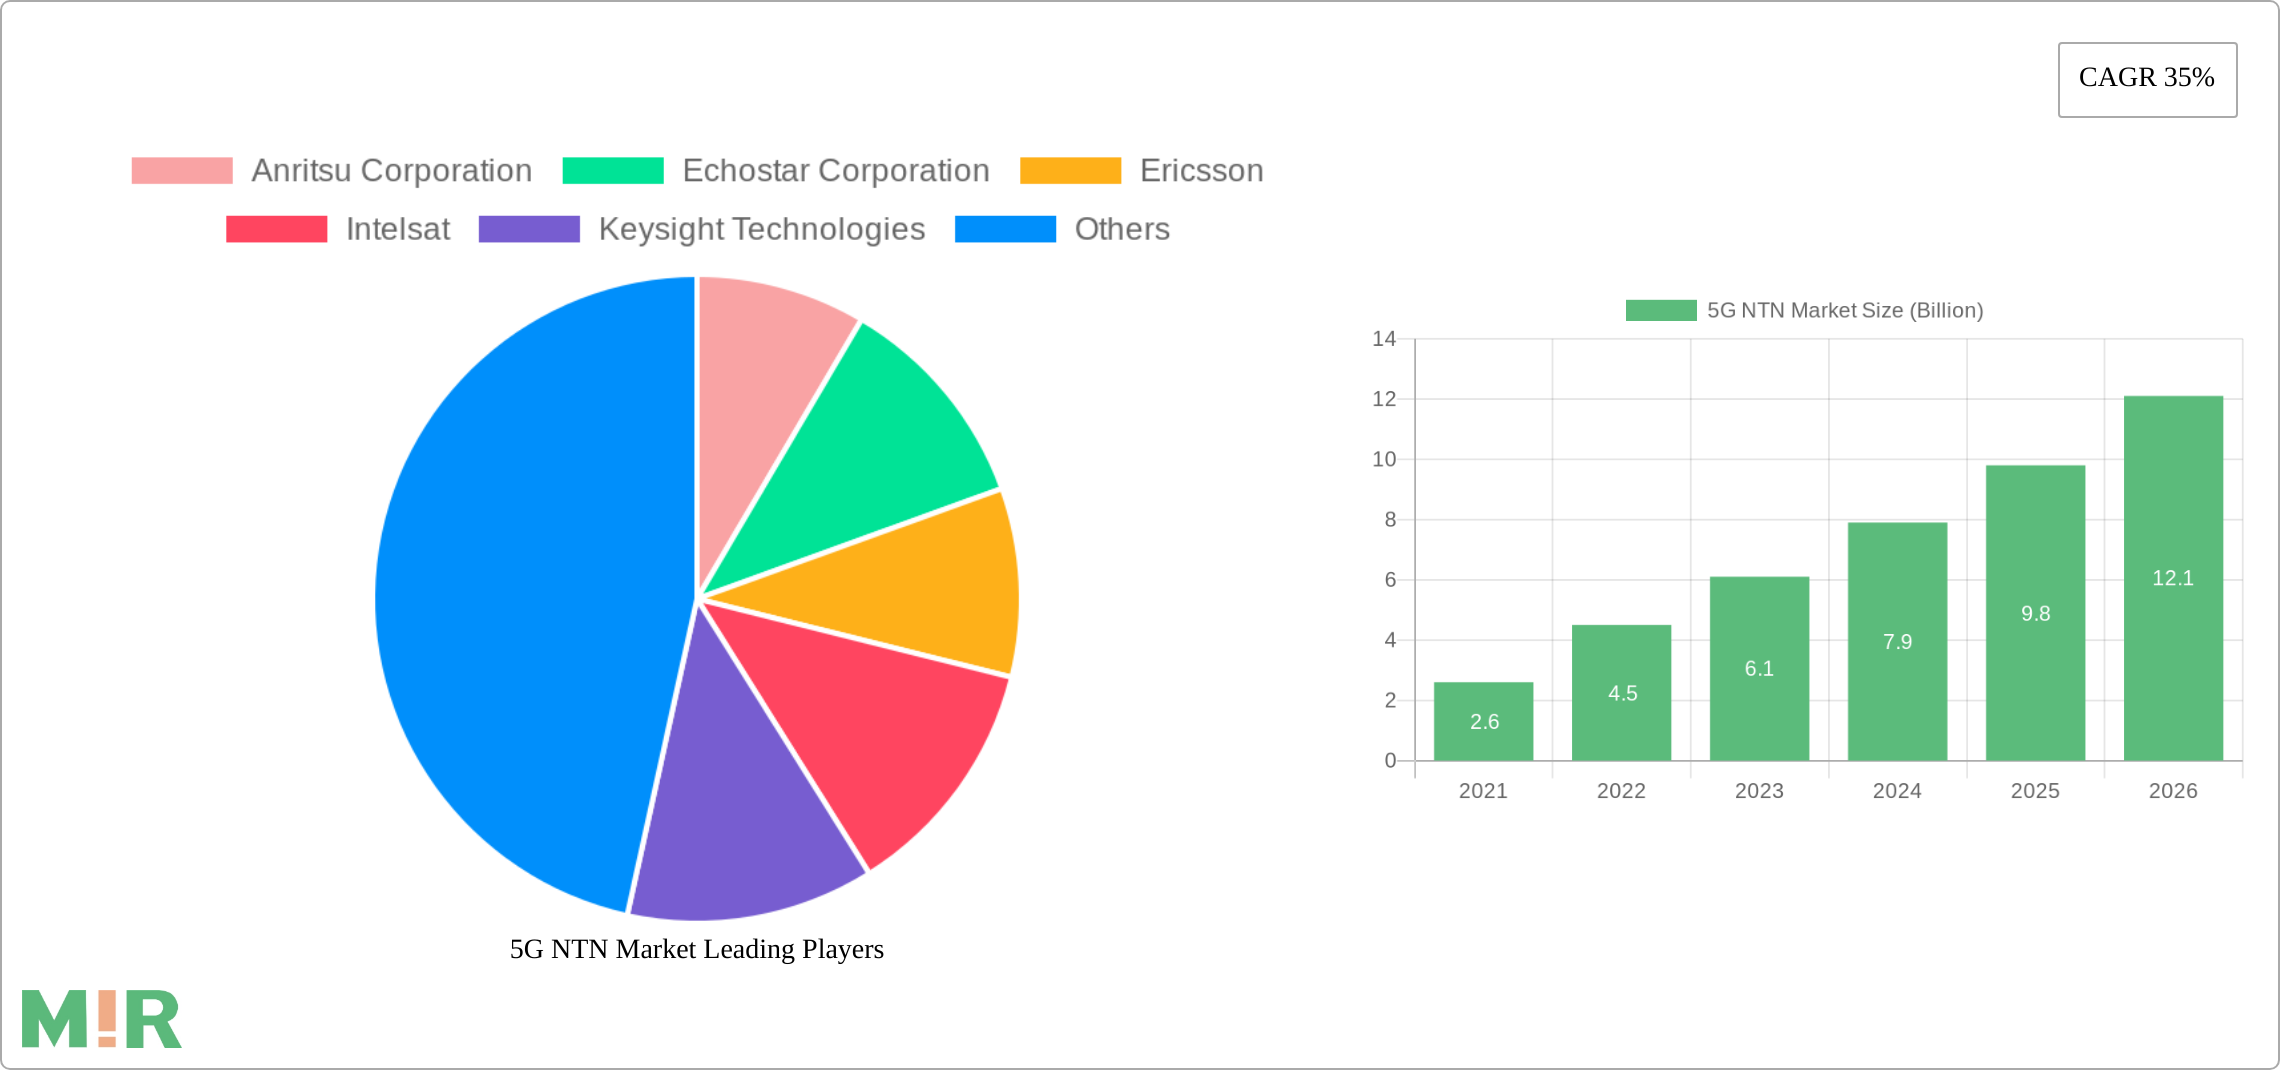
The projected CAGR is approximately 35%.

Market
Insights
Reports delivered globally, covering a wide range of industries and sectors.
Clients who trust our expertise and rely on our insights for business decisions.
Managed Reports, ensuring seamless updates and premium service.
Satisfied Customers, committed to delivering exceptional value and quality.
5G NTN Market by Component (Hardware, Software, Services), by Platform (UAS platform, LEO satellite, MEO satellite, GEO satellite), by Application (Enhanced Mobile Broadband (EMBB), Ultra Reliable and Low Latency Communications (URLCC), Massive Machine-Type Communications (MMTC)), by Location (Urban, Rural, Remote, Isolated), by End-Use (Maritime, Aerospace & defense, Government, Mining, Others), by North America (U.S., Canada), by Europe (UK, Germany, France, Italy, Spain, Russia, Nordics, Rest of Europe), by Asia Pacific (China, India, Japan, South Korea, ANZ, Southeast Asia, Rest of Asia Pacific), by Latin America (Brazil, Mexico, Argentina, Rest of Latin America), by MEA (UAE, Saudi Arabia, South Africa, Rest of MEA) Forecast 2025-2033
The size of the 5G NTN Market was valued at USD 4.2 Billion in 2024 and is projected to reach USD 34.32 Billion by 2033, with an expected CAGR of 35% during the forecast period. This rapid expansion is driven by the increasing demand for 5G NTN networks, which offer high-speed, low-latency connectivity in remote and underserved areas. Government initiatives supporting the deployment of 5G NTN networks, along with rising concerns about global communication infrastructure and food security, are further propelling market growth. The industry is witnessing the entry of key players, including Anritsu Corporation, Echostar Corporation, Ericsson, Intelsat, Keysight Technologies, MediaTek, Qualcomm Technologies, Rohde & Schwarz, Softbank Group, Thales Group, and ZTE Corporation. These companies are heavily investing in research and development to drive innovation and enhance network capabilities. As technology advances, the 5G NTN market is poised for substantial growth, reshaping global communication with seamless and efficient connectivity solutions.
The 5G NTN market is characterized by the presence of a few large players that dominate the market share. The market is concentrated in terms of technology and service offerings, with a few key players holding a significant share of the market. This concentration is due to the high cost of entry into the market and the need for specialized knowledge and expertise to develop and deploy 5G NTN networks. The market is also characterized by a high level of innovation, with new technologies and services being developed continuously. This innovation is driven by the need to meet the increasing demand for high-speed, low-latency connectivity. The market is also heavily regulated, with governments imposing strict rules and regulations on the deployment and operation of 5G NTN networks. These regulations are designed to ensure the safety and security of the networks and to prevent harmful interference with other wireless services.
One of the key trends in the 5G NTN market is the increasing use of artificial intelligence (AI) and machine learning (ML) to optimize network performance and efficiency. AI and ML algorithms can be used to automate network management tasks, such as traffic routing and congestion control. This can help to improve network performance and reduce operating costs. Another key trend is the development of new applications and services that leverage the capabilities of 5G NTN networks. These applications and services include things like cloud gaming, virtual reality, and augmented reality. The development of these applications and services is expected to drive demand for 5G NTN networks in the coming years.
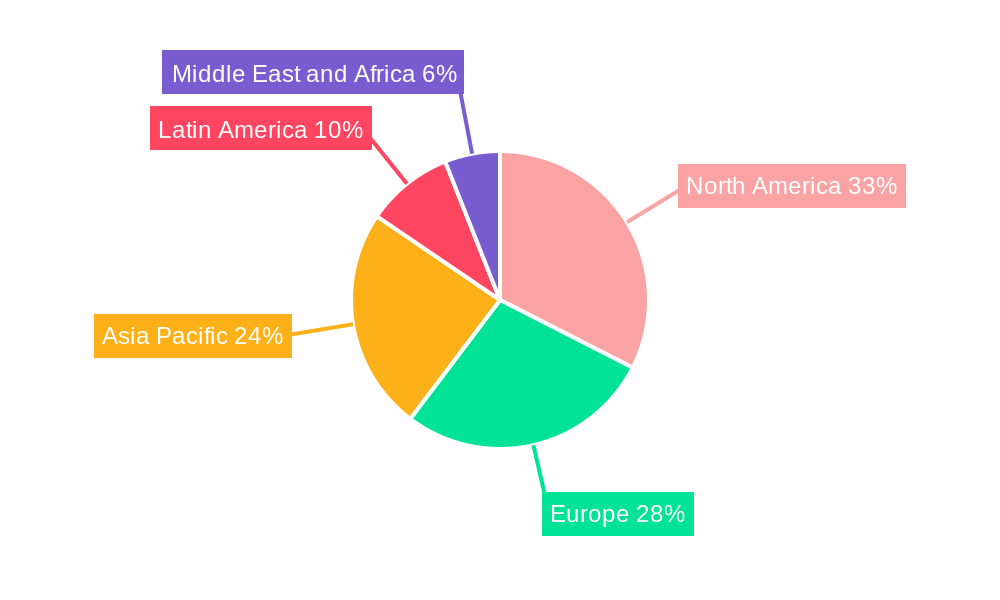
The Asia-Pacific region is expected to dominate the 5G NTN market during the forecast period. This is due to the region's large population and rapid economic growth. The region is also home to several major 5G NTN network operators, such as China Mobile, Vodafone Idea, and Bharti Airtel. These operators are investing heavily in the deployment of 5G NTN networks in order to meet the growing demand for high-speed, low-latency connectivity. In terms of segments, the hardware segment is expected to dominate the 5G NTN market during the forecast period. This is due to the need for new hardware, such as base stations and antennas, to support the deployment of 5G NTN networks.
The 5G NTN market report provides a comprehensive overview of the market, including market size, market share, and growth prospects. The report also provides an analysis of the market dynamics, including the key drivers, challenges, and opportunities. The report also includes a detailed segmentation of the market by component, platform, application, location, and end-use. The report also provides profiles of the key players in the market, including their financial performance, product portfolios, and market strategies.
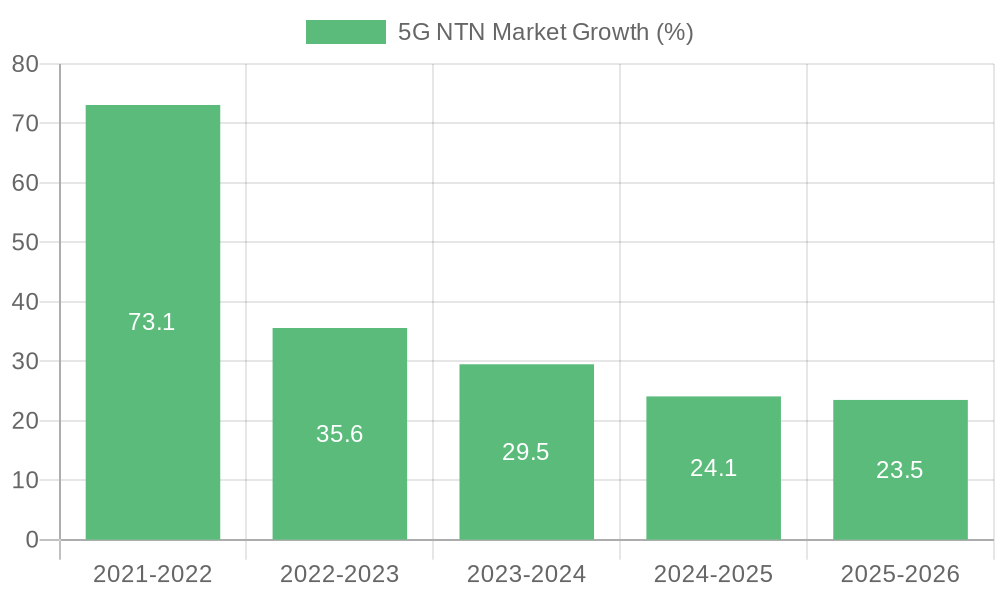
The 5G NTN market is expected to grow significantly over the next few years. This growth is being driven by the increasing demand for high-speed, low-latency connectivity. The market is also being driven by the growing number of applications and services that leverage the capabilities of 5G NTN networks. The Asia-Pacific region is expected to be the largest market for 5G NTN networks, followed by North America and Europe. The hardware segment is expected to dominate the market during the forecast period.
| Aspects | Details |
|---|---|
| Study Period | 2019-2033 |
| Base Year | 2024 |
| Estimated Year | 2025 |
| Forecast Period | 2025-2033 |
| Historical Period | 2019-2024 |
| Growth Rate | CAGR of 35% from 2019-2033 |
| Segmentation |
|


Note* : In applicable scenarios
Primary Research
Secondary Research

Involves using different sources of information in order to increase the validity of a study
These sources are likely to be stakeholders in a program - participants, other researchers, program staff, other community members, and so on.
Then we put all data in single framework & apply various statistical tools to find out the dynamic on the market.
During the analysis stage, feedback from the stakeholder groups would be compared to determine areas of agreement as well as areas of divergence
The projected CAGR is approximately 35%.
Key companies in the market include Anritsu Corporation, Echostar Corporation, Ericsson, Intelsat, Keysight Technologies, Mediatek, Qualcomm Technologies, Rohde & Schwarz, Softbank Group, Thales Group, ZTE Corporation.
The market segments include Component, Platform, Application, Location, End-Use.
The market size is estimated to be USD 4.2 Billion as of 2022.
Growing adoption of software-centric approach. Need for global connectivity for IoT devices. Increasing use of NTN connectivity in disaster response and emergency communications. Rising smart city initiatives across the globe.
One of the key trends in the 5G NTN market is the increasing use of artificial intelligence (AI) and machine learning (ML) to optimize network performance and efficiency. AI and ML algorithms can be used to automate network management tasks. such as traffic routing and congestion control. This can help to improve network performance and reduce operating costs. Another key trend is the development of new applications and services that leverage the capabilities of 5G NTN networks. These applications and services include things like cloud gaming. virtual reality. and augmented reality. The development of these applications and services is expected to drive demand for 5G NTN networks in the coming years..
High cost for development and deployment of infrastructure. Technical and operational challenges.
In October 2023, during the India Mobile Congress (IMC) 2023, MediaTek, a fabless semiconductor company, presented its newest technological advancements across various portfolios such as Dimensity, Filogic, Genio, Kompanio, Pentonic, and Dimensity Auto. The spotlight was on MediaTek's Dimensity Auto platform, designed to shape the future of intelligent, consistently connected vehicles by offering substantial computing power and a comprehensive range of technologies. The exhibition featured a diverse array of devices powered by MediaTek, showcasing the company's influence across various industries and its collaborations with major global brands.
Pricing options include single-user, multi-user, and enterprise licenses priced at USD 4,850, USD 5,350, and USD 8,350 respectively.
The market size is provided in terms of value, measured in Billion and volume, measured in units.
Yes, the market keyword associated with the report is "5G NTN Market," which aids in identifying and referencing the specific market segment covered.
The pricing options vary based on user requirements and access needs. Individual users may opt for single-user licenses, while businesses requiring broader access may choose multi-user or enterprise licenses for cost-effective access to the report.
While the report offers comprehensive insights, it's advisable to review the specific contents or supplementary materials provided to ascertain if additional resources or data are available.
To stay informed about further developments, trends, and reports in the 5G NTN Market, consider subscribing to industry newsletters, following relevant companies and organizations, or regularly checking reputable industry news sources and publications.
See the similar reports
Market Insights Reports offers comprehensive market research reports and analysis, giving businesses important information about their clients, rivals, and sector to help them make well-informed decisions on operations, marketing, and business strategy. We offer a variety of services in addition to market research, data analysis, and strategy planning. In order to find opportunities and learn more about our competitors and the industry at large, we employ competitive analysis. To identify areas for development, we also evaluate our performance against that of our rivals. We can determine the places at which we can offer our clients the most value by performing value chain analysis.
Additionally, clients receive a thorough overview of their industry business environment. We can find trends that help us forecast future possibilities and threats by examining global macroeconomic dynamics and consumer behavior patterns. By analyzing their features and advantages, contrasting them with comparable items on the market, and evaluating both their quantitative and qualitative performance, we comprehensively evaluate our clients' products. This allows us to assist customers in determining how their goods compare to those of their rivals and in creating successful marketing plans. Our group has been successful in gaining a thorough grasp of our clients' requirements and offering them creative solutions. We currently provide services to more than 50 nations in Europe, the Middle East, Africa, Latin America, Asia Pacific, and North America. Because of our global reach, we have been able to establish trusting bonds with our partners and clients in various nations, improving customer service and forging a more cohesive worldwide presence.
We use cookies to enhance your experience.
By clicking "Accept All", you consent to the use of all cookies.
Customize your preferences or read our Cookie Policy.

